Understanding Disasters in Houston
How natural disasters and COVID-19 affect our region and residents
Greater Houston has experienced seven federally declared disasters since 2015, including the novel coronavirus pandemic. We Houstonians are accustomed to natural disasters such as hurricanes, flooding and the occasional spin-off tornado. In addition to a record-breaking hurricane season, the year 2020 has brought a public health disaster and resulting economic crisis to our doorstep.
The more we understand how disasters have affected our region, the more we can do to minimize our risk, mitigate negative impacts, and improve our response so that everyone in our community — especially the most vulnerable — can bounce back quickly.
A note about the data:
Data on the impact of hurricanes and flooding on residents in Greater Houston has historically been thin. However, in the aftermath of Hurricane Harvey, more is being done to capture the various ways in which Greater Houston residents are affected by natural disasters and flooding beyond the usual metrics. If the following subtopic pages tend to overemphasize Hurricane Harvey, it is for that reason — though Understanding Houston makes attempts to provide data on other disasters in the region when possible.
We also acknowledge that building our disaster resiliency and measuring the region’s progress requires a more expansive set of data than what you’ll find here. Our ability to bounce back from disasters is tied to economic, social, environmental infrastructure attributes and assets, as well as capacities that include social capital, community functions, connectivity and planning. Data limitations prevent us from addressing all these areas, but the data presented here speaks to the human, social and economic toll disasters take on our region — with an emphasis on our region’s most vulnerable populations.
Vote for what matters to you
What issues do you think need attention, resources, and collaborative action?
47 votes
There are four subtopics for
disasters in Houston
Risks
26
Federal disaster declarations in Greater Houston in 41 years.
Climate disasters in the form of hurricanes and rain storms pose a serious threat to the Houston region, and the risks are only projected to increase in the future.
In this page we talk about the following:
Natural Disaster Risks in Houston
Exploring natural disaster risks in our region
In the greater Houston region, natural disasters have become more frequent, dangerous and costly. The risks are only projected to increase in the future, threatening Houstonians’ lives and livelihoods.
Why natural disaster risks matter to Houston
Those who live in Greater Houston are all too familiar with the risk of natural disasters in the form of flooding or hurricanes. Hundreds of thousands of properties in the region are currently at risk of flooding, and that figure is only projected to increase over time as storms become more intense and common. This increasing risk poses a threat to the safety of all residents. Without a stronger understanding of our current and future risk, our region’s residents and leaders cannot fully prepare for or mitigate the catastrophic consequences of frequent disasters.
The more we understand the scope of disasters and the effects of climate change in our region, the more we can do to minimize risks to our community.
The data
History of Disasters in the Houston area
The Federal Emergency Management Agency (FEMA) has declared a disaster in Fort Bend, Harris or Montgomery counties — the three most populous counties in Greater Houston — 26 times in the past 41 years, including the most recent severe winter storm in February 2021. Nearly a third of those (eight) have occurred since 2015.
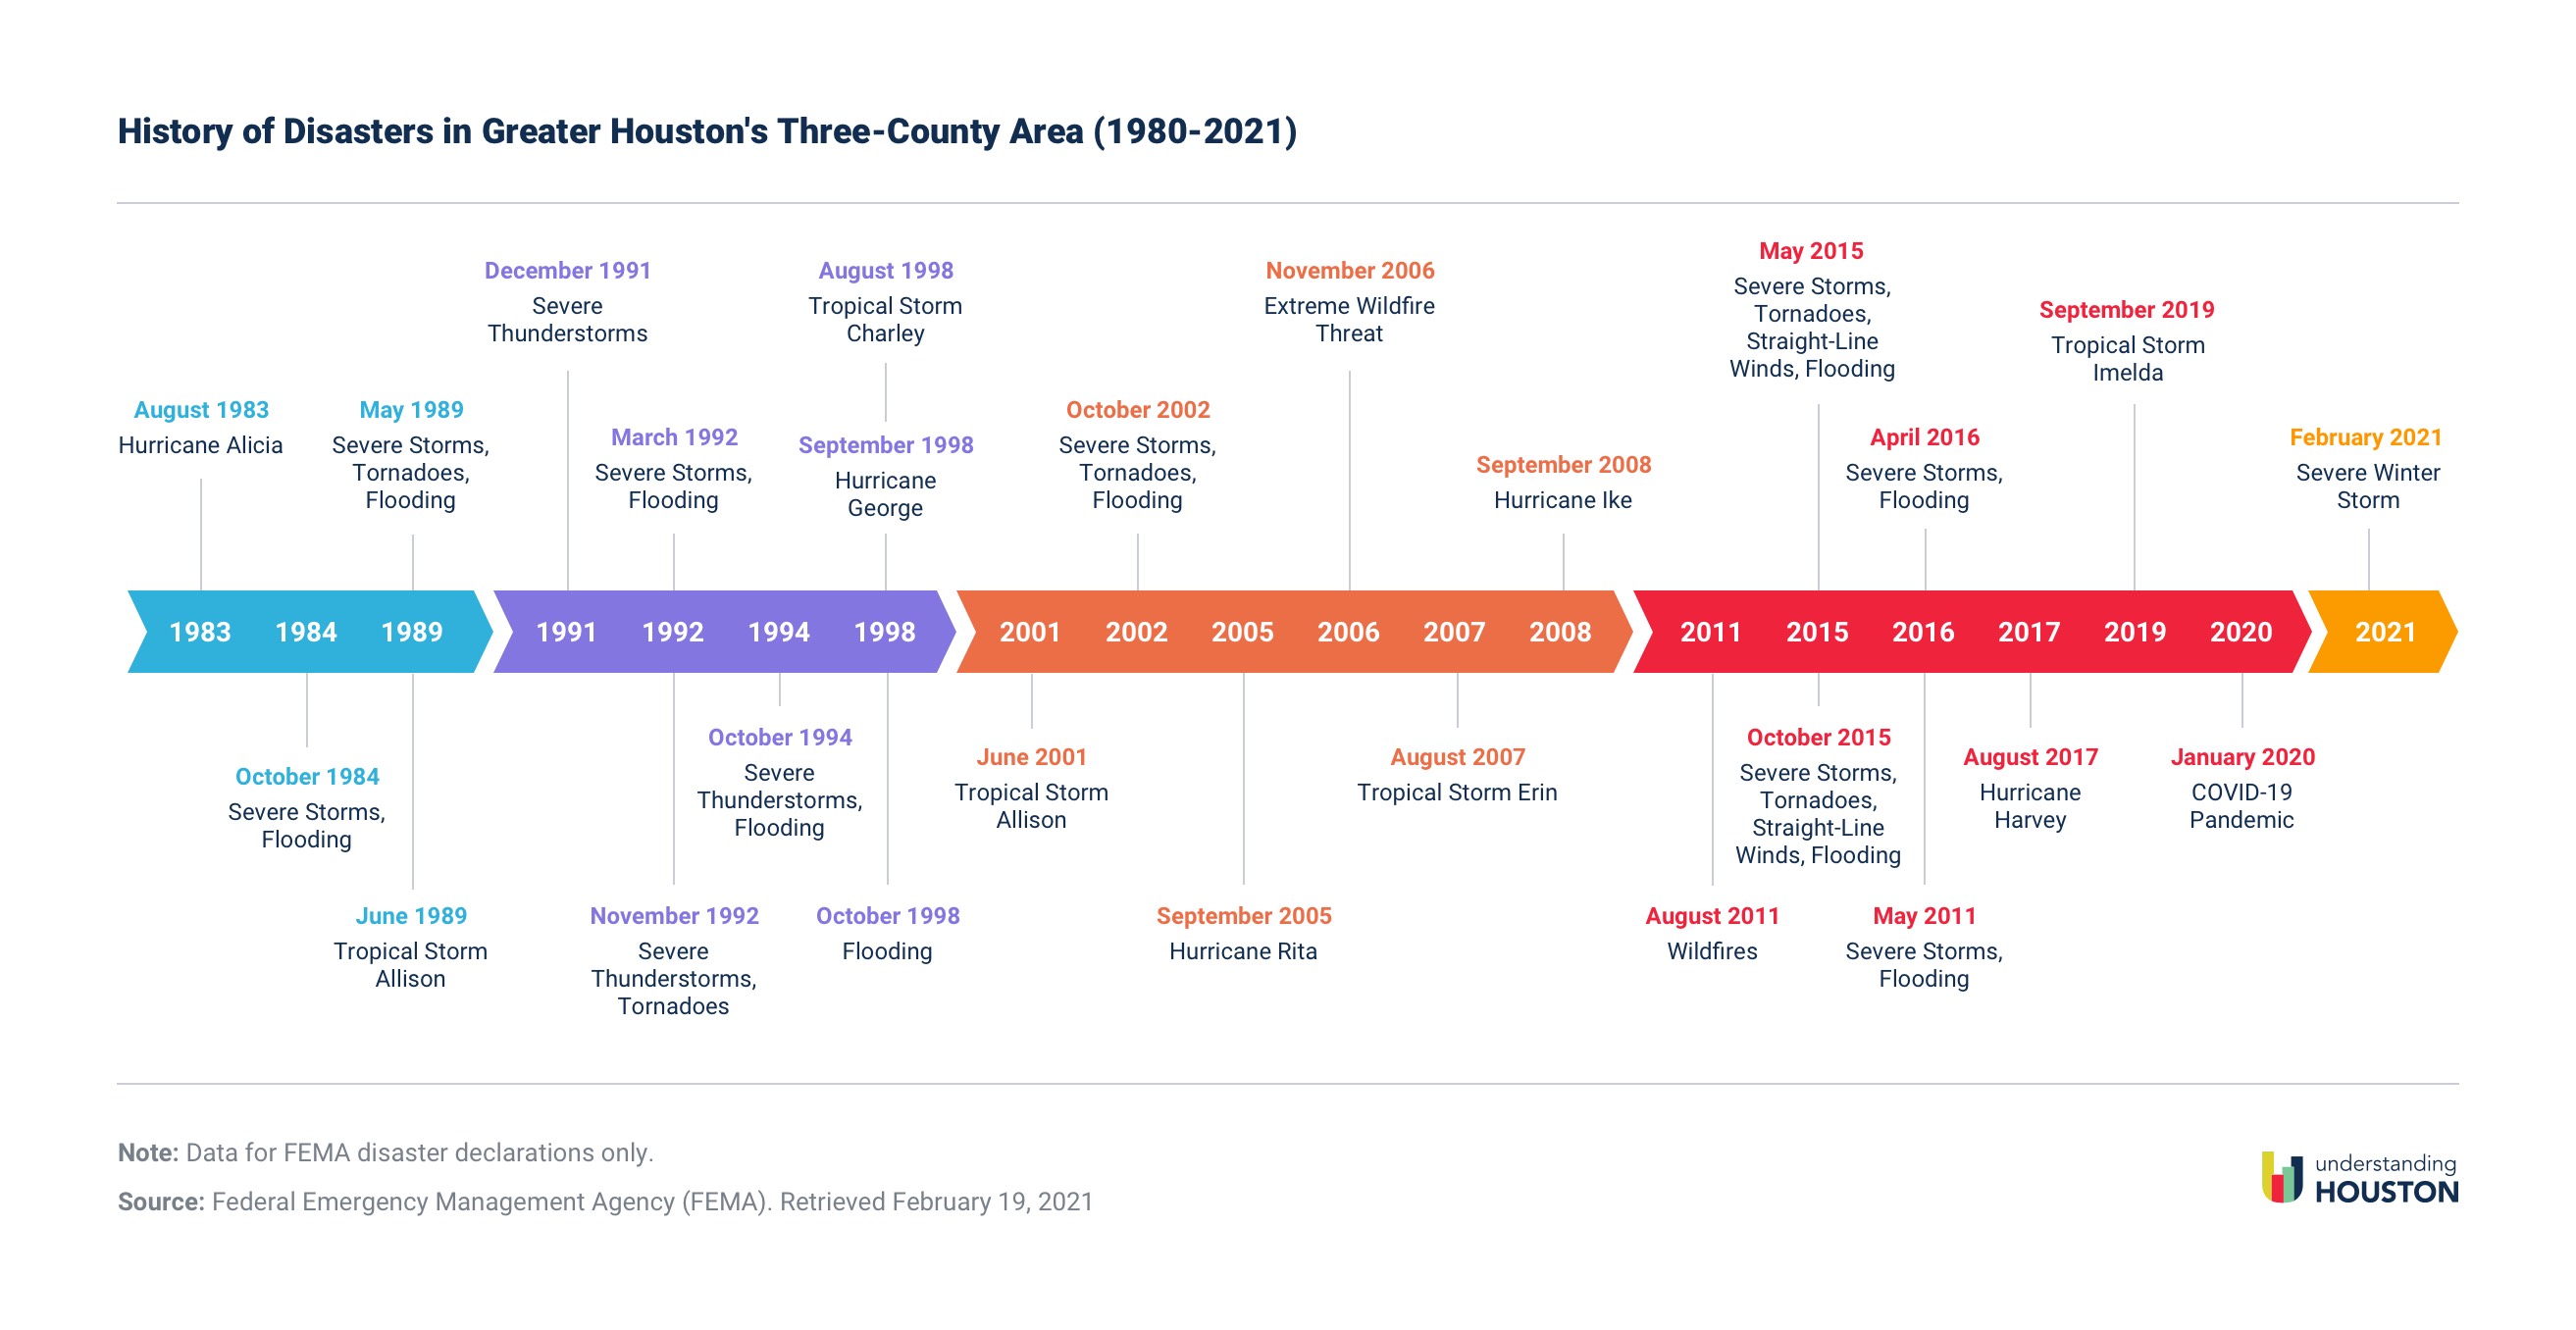
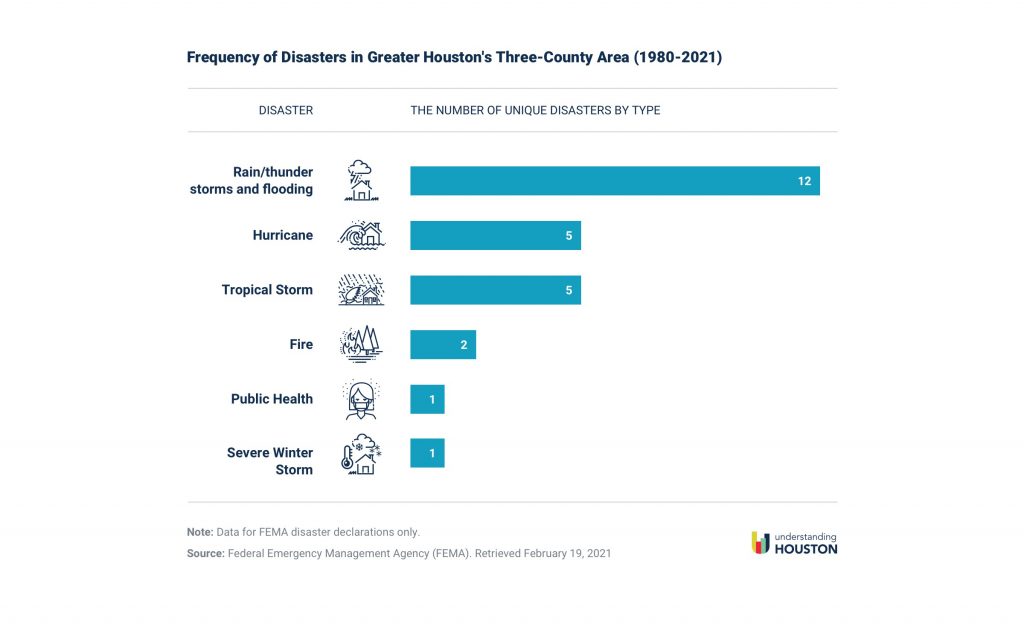
Since 1980, the Greater Houston region has experienced 12 major rain/thunderstorm and/or flood events, five hurricanes, five tropical storms, two wildfires, a pandemic caused by the new coronavirus, and, most recently a severe winter storm in February 2021 which caused week-long power and water outages, busted pipes, and boil water notices.
The fact that about half of these disasters were caused by unnamed storms would not surprise most residents of the Greater Houston area, where heavy rains and flooding are commonplace.
Flooding risk in the Houston area
FEMA creates flood maps to designate areas lying in different flood zones based on varying levels of risk. Properties identified as having at least a 1% chance of flooding in any given year (also known as the base flood or 100-year flood) are designated as a Special Flood Hazard Area (SFHA) — the highest risk. Areas that have a 0.2% annual chance of flooding (a 500-year flood) are considered more “moderate” risk.
However, these maps have limitations that don’t accurately predict where flooding occurs. An analysis of flood claims in southeast Harris County between 1999 and 2009 found that 75% of damages were outside the 100-year flood plain.1 The region experienced five major floods during that time, none of which met the criteria of a 100-year storm. Additionally, a 2012 study across the three decades before Hurricane Harvey found that 47% of flood damage claims made by Harris County residents were outside the 100-year flood zone.2 More than half (55%) of homes damaged in the Tax Day Flood in 2016 were outside the 500-year zone, as were one-third of homes damaged during the Memorial Day Flood in 2015, according to an analysis by the Houston Chronicle. Three out of four homes and apartments in Harris County that flooded during Hurricane Harvey were outside the 100-year flood zone, and half of homes damaged were outside all flood zone designations.
First Street Foundation has developed specialized floodplain maps using a model that expands on FEMA’s current maps. While the FEMA maps are based on risk from a single 1-in-100-year or 1-in-500-year event, First Street’s model considers additional factors, such as rainfall flood risk, current climate risk, and areas not mapped by FEMA.
First Street identified 244,842 properties that are at substantial risk of flooding (located within their 100-year flood area) in the three counties — that’s 56,680, or 30%, higher than current FEMA estimates of 188,162. First Street’s model found 60,411 properties are at risk of flooding in Fort Bend County compared to 13,227 identified by FEMA. This is primarily due to incorporating the chance of levee failure in their models.
Given Houston’s history of flooding well-beyond the designated “high risk” zone, current flood maps haven’t accurately predicted the extent of flooding in the region. The broadest measure of flood risk expands beyond the number of properties within the 100-year flood zone to include those located in floodways, “protected” by levees, and are in the 500-year flood zone. Using this definition, more than 322,000 residential properties (21.7% of all residential properties) in Greater Houston are located in a flood plain.
Harris County has the most residential properties located in a floodplain (234,404), the majority of which are in 500- and 100-year flood zones. In Fort Bend County, where 68,264 residential properties are at some risk of flooding, the majority of those properties are protected only by a levee. Most residential properties in Montgomery County that are at risk of flooding are located in the 500-year flood zone.
In Fort Bend, 29.5% of residential properties are located in all flood areas combined, compared to 21.8% in Harris County and 11.1% in Montgomery County.
Disproportionate flood risks
Research has shown that the communities most vulnerable to flooding are low-income and non-white.3 This is especially true in Houston where these groups have historically lived on low-lying land (a result of decades of discriminatory housing policies), receive fewer flood mitigation projects, and are characterized by decades of disinvestment, such as poor stormwater infrastructure.4 A recent study found that Black and Latino Harris County residents who lived outside the FEMA-designated 100-year flood zone were flooded at disproportionately high rates during Hurricane Harvey.5
This proves particularly challenging as low-income homeowners seek to rebuild or prepare for the next disaster. FEMA’s “50% rule” states that if the cost of improvements or the cost to repair a property exceeds half its [pre-disaster] market value (known as “substantial damage”) it must be brought up to current floodplain management standards. This regulation is particularly challenging for households living in homes appraised at lower values because the typical minimum cost of home repair after a flood is around $25,000. That means homes valued at less than $50,000, for example, are typically out of repair options and at greater risk of further damage when the next storm hits.
More than 32,000 residential properties valued at less than $50,000 are located in flood areas in the three-county region, with the majority being located in Harris County.
In Harris and Montgomery counties, homes that are valued below $50,000 are more likely to be found in a flood area. Across the three-county region, 23.3% of residential properties valued at $50,000 or less are located in flood areas, compared to 21.7% of all residential properties.
Future flood risk
We know that extreme rain poses a growing threat to the Houston area, which means the frequency and intensity of flooding will continue to increase. First Street Foundation projects more properties will flood in the future because of rising sea levels and changing hurricane patterns — consequences of climate change.
The number of properties in Harris County at risk of flooding is projected to increase to 204,513 in 2050 (up 21.7% from 2020). As many as 64,000 in Fort Bend and 17,600 in Montgomery counties are at “substantial” risk of flooding in 2050.
That means potentially one in seven (14.2%) of properties in the three-county region will be at risk of flooding by 2050. That is about one in five properties in Fort Bend, one in seven in Harris, and one in 15 in Montgomery counties — each higher than the rate for Texas overall.
References:
- Blessing, R., Sebastian, A., & Brody, S. (2017). Flood Risk Delineation in the United States: How Much Loss Are We Capturing? Natural Hazards Review, 18, 04017002. https://doi.org/10.1061/(ASCE)NH.1527-6996.0000242.
- Highfield, W.E., Norman, S.A. & Brody, S.D. (2013). Examining the 100‐Year Floodplain as a Metric of Risk, Loss, and Household Adjustment. Risk Analysis, 33: 186-191. https://doi.org/10.1111/j.1539-6924.2012.01840.x.
- National Academies of Sciences, Engineering, and Medicine. (2019). Framing the Challenge of Urban Flooding in the United States. https://doi.org/10.17226/25381.
- Chakraborty, J., Collins, T.W., & Grineski, S. E. (February 1, 2019). Exploring the Environmental Justice Implications of Hurricane Harvey Flooding in Greater Houston, Texas. American Journal of Public Health, 109, no. 2: pp. 244-250. https://doi.org/10.2105/AJPH.2018.304846.
- Smiley, K.T. (2020). Environmental Research Letters, 15 0940b3. https://doi.org/10.1088/1748-9326/aba0fe.
Vulnerability & Impacts
3.4 million residents
in the three-county region live in a census tract with at least medium-high vulnerability to disaster impacts.
The impacts of natural disasters are far-reaching and affect our entire region. However, some communities are hit harder than others.
In this page we talk about the following:
Vulnerability to and Impacts from Disasters
Exploring unequal effects of natural disasters on Houston communities
Natural disasters have impacted hundreds of thousands of families in Greater Houston over the past 40 years. Non-white and low-income communities are not only more vulnerable to the impacts of disasters but also are disproportionately affected in significant ways.
Why measuring vulnerability to the impacts of natural disasters matters to Houston
Disasters affect people’s lives in many different ways — financially, physically, emotionally and more — and the effects can linger well after the storm passes. However, not everyone is affected in the same way. Research has shown that some populations and communities are disproportionately affected by natural disasters. Just as one’s ability to fight an illness depends a good deal on the health of the individual, a community’s ability to defend itself from negative shocks caused by a disaster largely depends on its economic, demographic and social health before a storm hits. Black, Latino, low-income and immigrant communities are more vulnerable to the stresses and shocks caused by natural disasters — the result of discrimination, economic and racial segregation, disinvestment, and other challenges – both past and present.
The more we understand about which communities are hardest hit by disasters and in what ways, the better job we can do to prioritize resources to strengthen communities before disasters strike.
The data
Social vulnerability to disasters in the Houston area
Before diving into the data on social vulnerability in Houston, let’s define what it means to be socially vulnerable. How does FEMA define vulnerability? FEMA defines social vulnerability as the susceptibility of social groups to the adverse impacts of natural hazards, including disproportionate death, injury, loss, or disruption of livelihood.
The extent to which natural disasters affect households depends largely on their situation before disaster strikes. Non-white, low-income and immigrant families typically report impacts from disasters that are more severe than those experienced by white, higher-income and native-born families. In part, this is because these groups tend to have lower levels and quality of economic and job security, housing stability and conditions, health insurance coverage, and financial windfall, even prior to a disaster. At the same time, the neighborhoods impacted most are those that were established by segregation, are typically located in low-lying areas, and have experienced decades of disinvestment.1 When disaster comes, these challenges are only exacerbated.
The Centers for Disease Control and Prevention’s (CDC) Social Vulnerability Index (SVI) measures the social vulnerability of counties and census tracts on a scale from 0 (indicating the lowest vulnerability) to 1 (highest vulnerability). Research suggests counties with high vulnerability tend to be less resilient to hazards or shocks and have higher levels of human and economic suffering and loss.2 Part of this is associated with the level of access to resources needed to prepare for, cope with and recover from disasters.
Among Houston’s three most populous counties, Harris County’s SVI is the highest at 0.72, meaning that it is more vulnerable to the negative effects of disasters than 72% of counties across the nation. Fort Bend (0.29) and Montgomery (0.39) counties are less vulnerable by comparison. Their overall vulnerability relative to other counties remained relatively flat between 2014 and 2018.
A total of 3.4 million residents — or 58% — in the three-county region live in a census tract with at least medium-high vulnerability (greater than 0.5). In Harris County, almost 3 million residents, or 64% of the population, live in a census tract that is more vulnerable than half the census tracts in the nation. In Fort Bend County, 239,110 residents (32%), and in Montgomery County, 247,766 (45%), live in census tracts with medium-high vulnerability or higher.
View your neighborhood’s Social Vulnerability Index ranking with the map below.
What makes a person vulnerable to disasters?
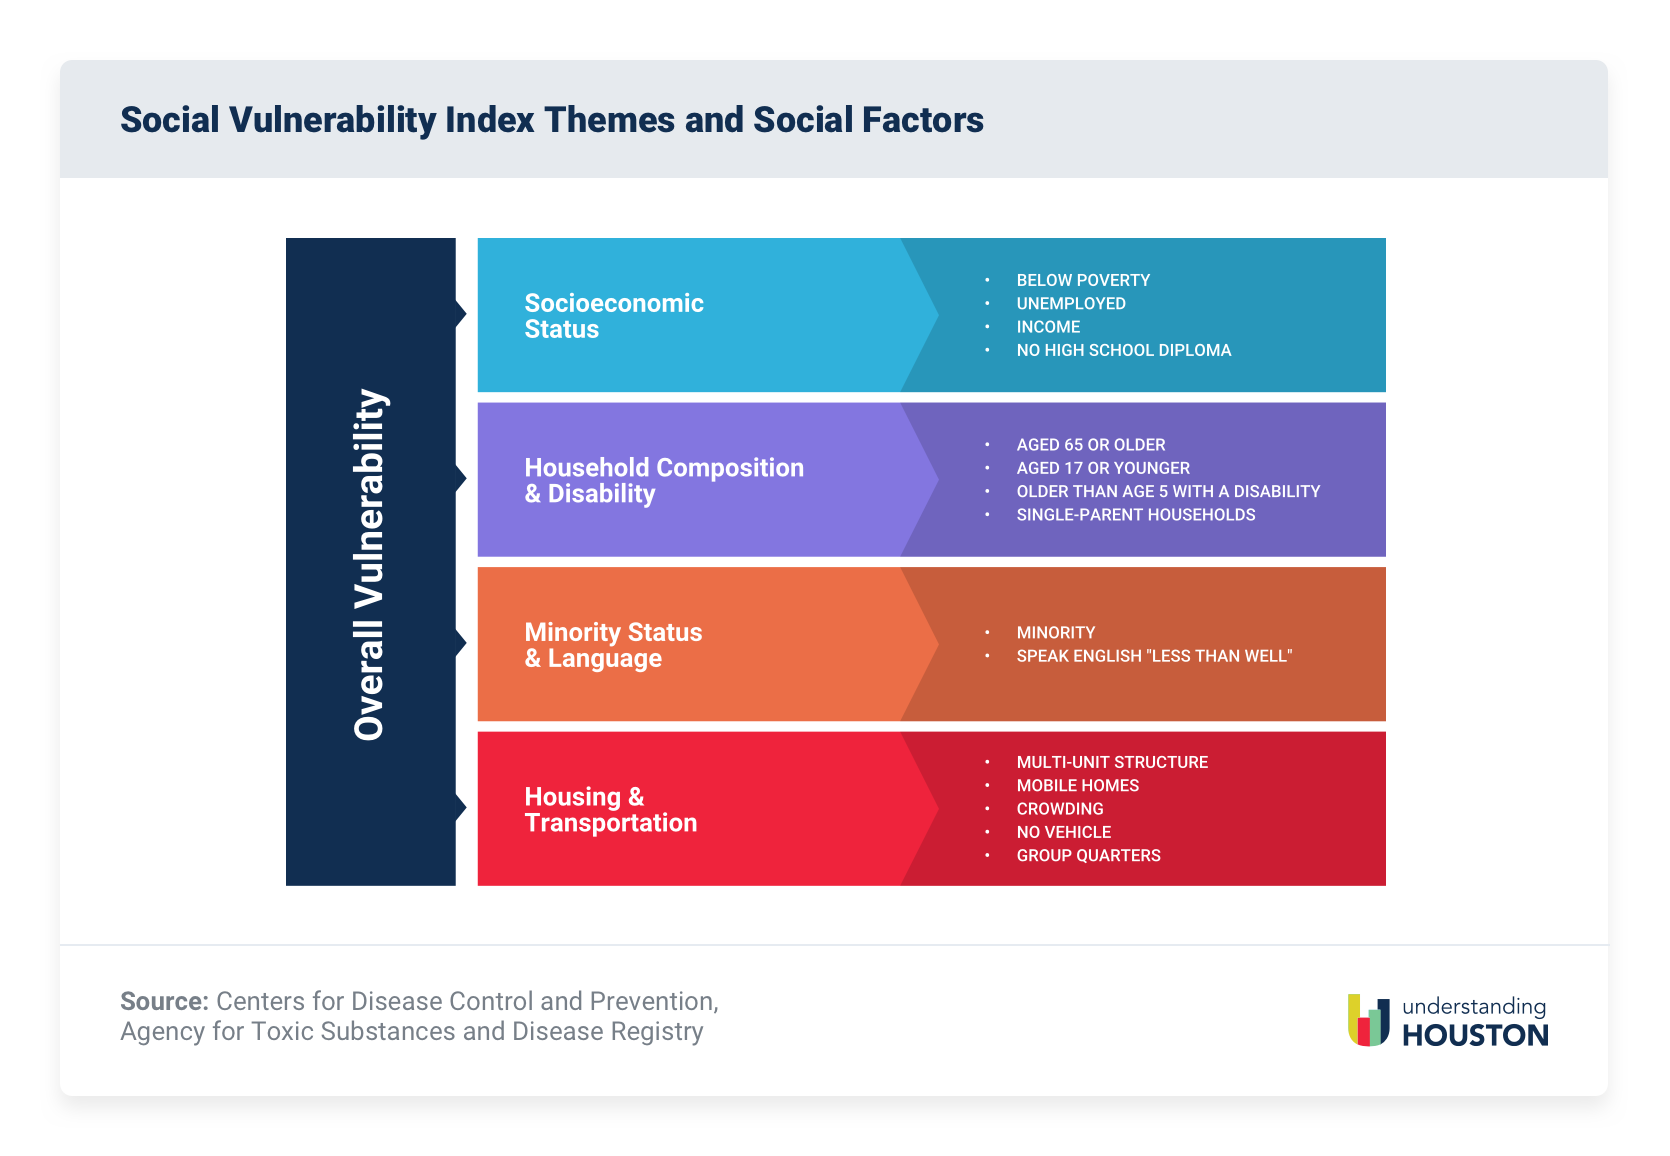
The SVI comprises 15 demographic characteristics and social factors across four themes: socioeconomic status, household composition and disability, non-white status and language, and housing and transportation. Examples of vulnerabilities that increase a community’s SVI (i.e., indicating more vulnerability to impacts from disasters), include higher proportions of residents living in poverty, residents older than 64 years or younger than 18 years, non-white residents, and those with poor housing conditions and unreliable transportation.
One of the strongest determinants of community resilience is income and wealth. Higher-income communities are most likely to have access to resources that mitigate disaster impacts and facilitate recovery, allowing residents to be able to move on from disasters relatively swiftly. However, income is only part of the equation. Families of four that earn the median income for the region can still be economically insecure after incorporating the high costs of housing, transportation and other necessities.
Vulnerable households are more likely to experience food insecurity in times of disaster as food prices increase, food availability diminishes from disrupted supply chains, and public transportation halts. Of course, households with more disposable income that can regularly stock non-perishable goods, hygiene products and water are less likely to feel these impacts.
Fort Bend’s medium-low overall vulnerability index masks the fact that the county’s substantial non-white population could be at higher risk of vulnerability to disaster impacts. Any disaster preparedness plan in Fort Bend County should include protocols to target its residents who are potentially more vulnerable to disaster because of limited English language skills and/or social capital to call upon for help. Montgomery County reports higher social vulnerability than Fort Bend on household composition/disability and housing. Harris County is more vulnerable than the other two counties on all measures.
Read more about disaster relief in Houston.
Financial impacts of disasters in the Houston area
To address urgent basic needs, the Federal Emergency Management Administration (FEMA) provides housing vouchers or cash directly to those affected through its Individual and Household Program (IHP), which is used to cover expenses caused by the disaster, including medical care, dental care, child care, funeral and burial costs, essential household items, clean-up items, moving and storage costs, and vehicle maintenance. Typically, the number of IHP requests from residents to FEMA indicates the scope of impact and need after a disaster.
More than half a million households across the three-county area applied for FEMA assistance in the aftermath of Hurricane Harvey, compared to 104,000 after Hurricane Rita and 442,000 following Hurricane Ike. The majority of those seeking assistance after Hurricane Harvey were renters, whereas more homeowners sought assistance after Hurricane Ike. The number of households seeking assistance after floods and tropical storms is smaller than after hurricanes, and homeowners typically make up the majority of requests.
However, not all households that request assistance from FEMA receive it. Low-income households are less likely to receive government assistance.3 One reason for this is that FEMA uses the home’s value before the disaster to determine the level of assistance. If homes have “substantial damage” after the storm combined with “pre-existing” conditions, they are less likely to receive funding for repairs.
The approval rate in the three-county area rarely rose above 50% for most disasters occurring since 2005, and homeowners were more likely to be approved than renters in seven of the last nine disasters. Approval rates for both homeowners and renters are lower in Harris County than in Fort Bend or Montgomery counties.
Three out of five Harris County residents reported financial challenges after Hurricane Harvey, according to a survey conducted one year after the storm by the Episcopal Health Foundation in partnership with the Kauffman Family Foundation. About 51% of white residents experienced financial struggles, compared to nearly 64% of Latinos and 75% of Black residents. One year later, 31% of Black respondents reported being in a worse financial position, compared to 25% of whites, as a result of the hurricane.
Housing impacts of disasters in the Houston area
FEMA provides data on the average cost of damage homeowners experience after disasters, regardless of whether the agency provides financial assistance to rebuild or repair.
Homeowners in the three-county region experienced damage at an average cost of $8,937 after the Memorial Day Flood in 2016, which caused the most damage to homeowners in Fort Bend County. Montgomery County homeowners experienced the most damage from the 2016 Memorial Day Flood and Tropical Storm Imelda. The average damage in Harris County was highest for Tropical Storm Erin and the 2016 Memorial Day Flood.
Slightly more than 8% of Harris County respondents who were displaced by Hurricane Harvey were still living in a temporary shelter a year later, according to the Episcopal Health Foundation Survey. Many returned home to find an unlivable space and reported their current living conditions were not safe. Nearly three out of 10 households with incomes less than 200% of the Federal Poverty Level (FPL) cited unsafe living conditions, compared to one in 10 households with higher incomes. Hispanic residents of the 24-county area also reported higher rates of unsafe living conditions due to damage from Hurricane Harvey.
Environmental impacts of disasters and public health in the Houston area
Environmental impacts from flooding and other natural disasters in Houston’s three-county region can have significant effects on public health, both short-term and long-term. Sewage, debris and chemicals mix with flood waters.4 Chemicals known to be carcinogenic and gasses that worsen respiratory problems are released into the soil, water and air.
Water Quality
Rising water levels, flooding and heavy rainfall can carry pollutants into water bodies, residential homes and potable water supply.5 Sewage plants, for instance, are often located in low-lying areas, and are susceptible to flooding.6 When these plants or streets flood, sewage discharges into the flood water. The same happens when refineries and chemical plants are flooded — industrial waste from factories mixes with the flood water.7 Contaminated flood water flows into streets, streams and rivers, and also infiltrates groundwater.
During Hurricane Harvey in August 2017, thousands of gallons of sewage mixed with the one trillion gallons of rain dumped on the region, resulting in high levels of E. coli contamination in local bayous and creeks, neighborhood streets, and residents’ living rooms.8 The map below shows the results for 37 water samples, taken between September 4 — 11, 2017 from surface water, flood water, and the interior of homes across Harris County.
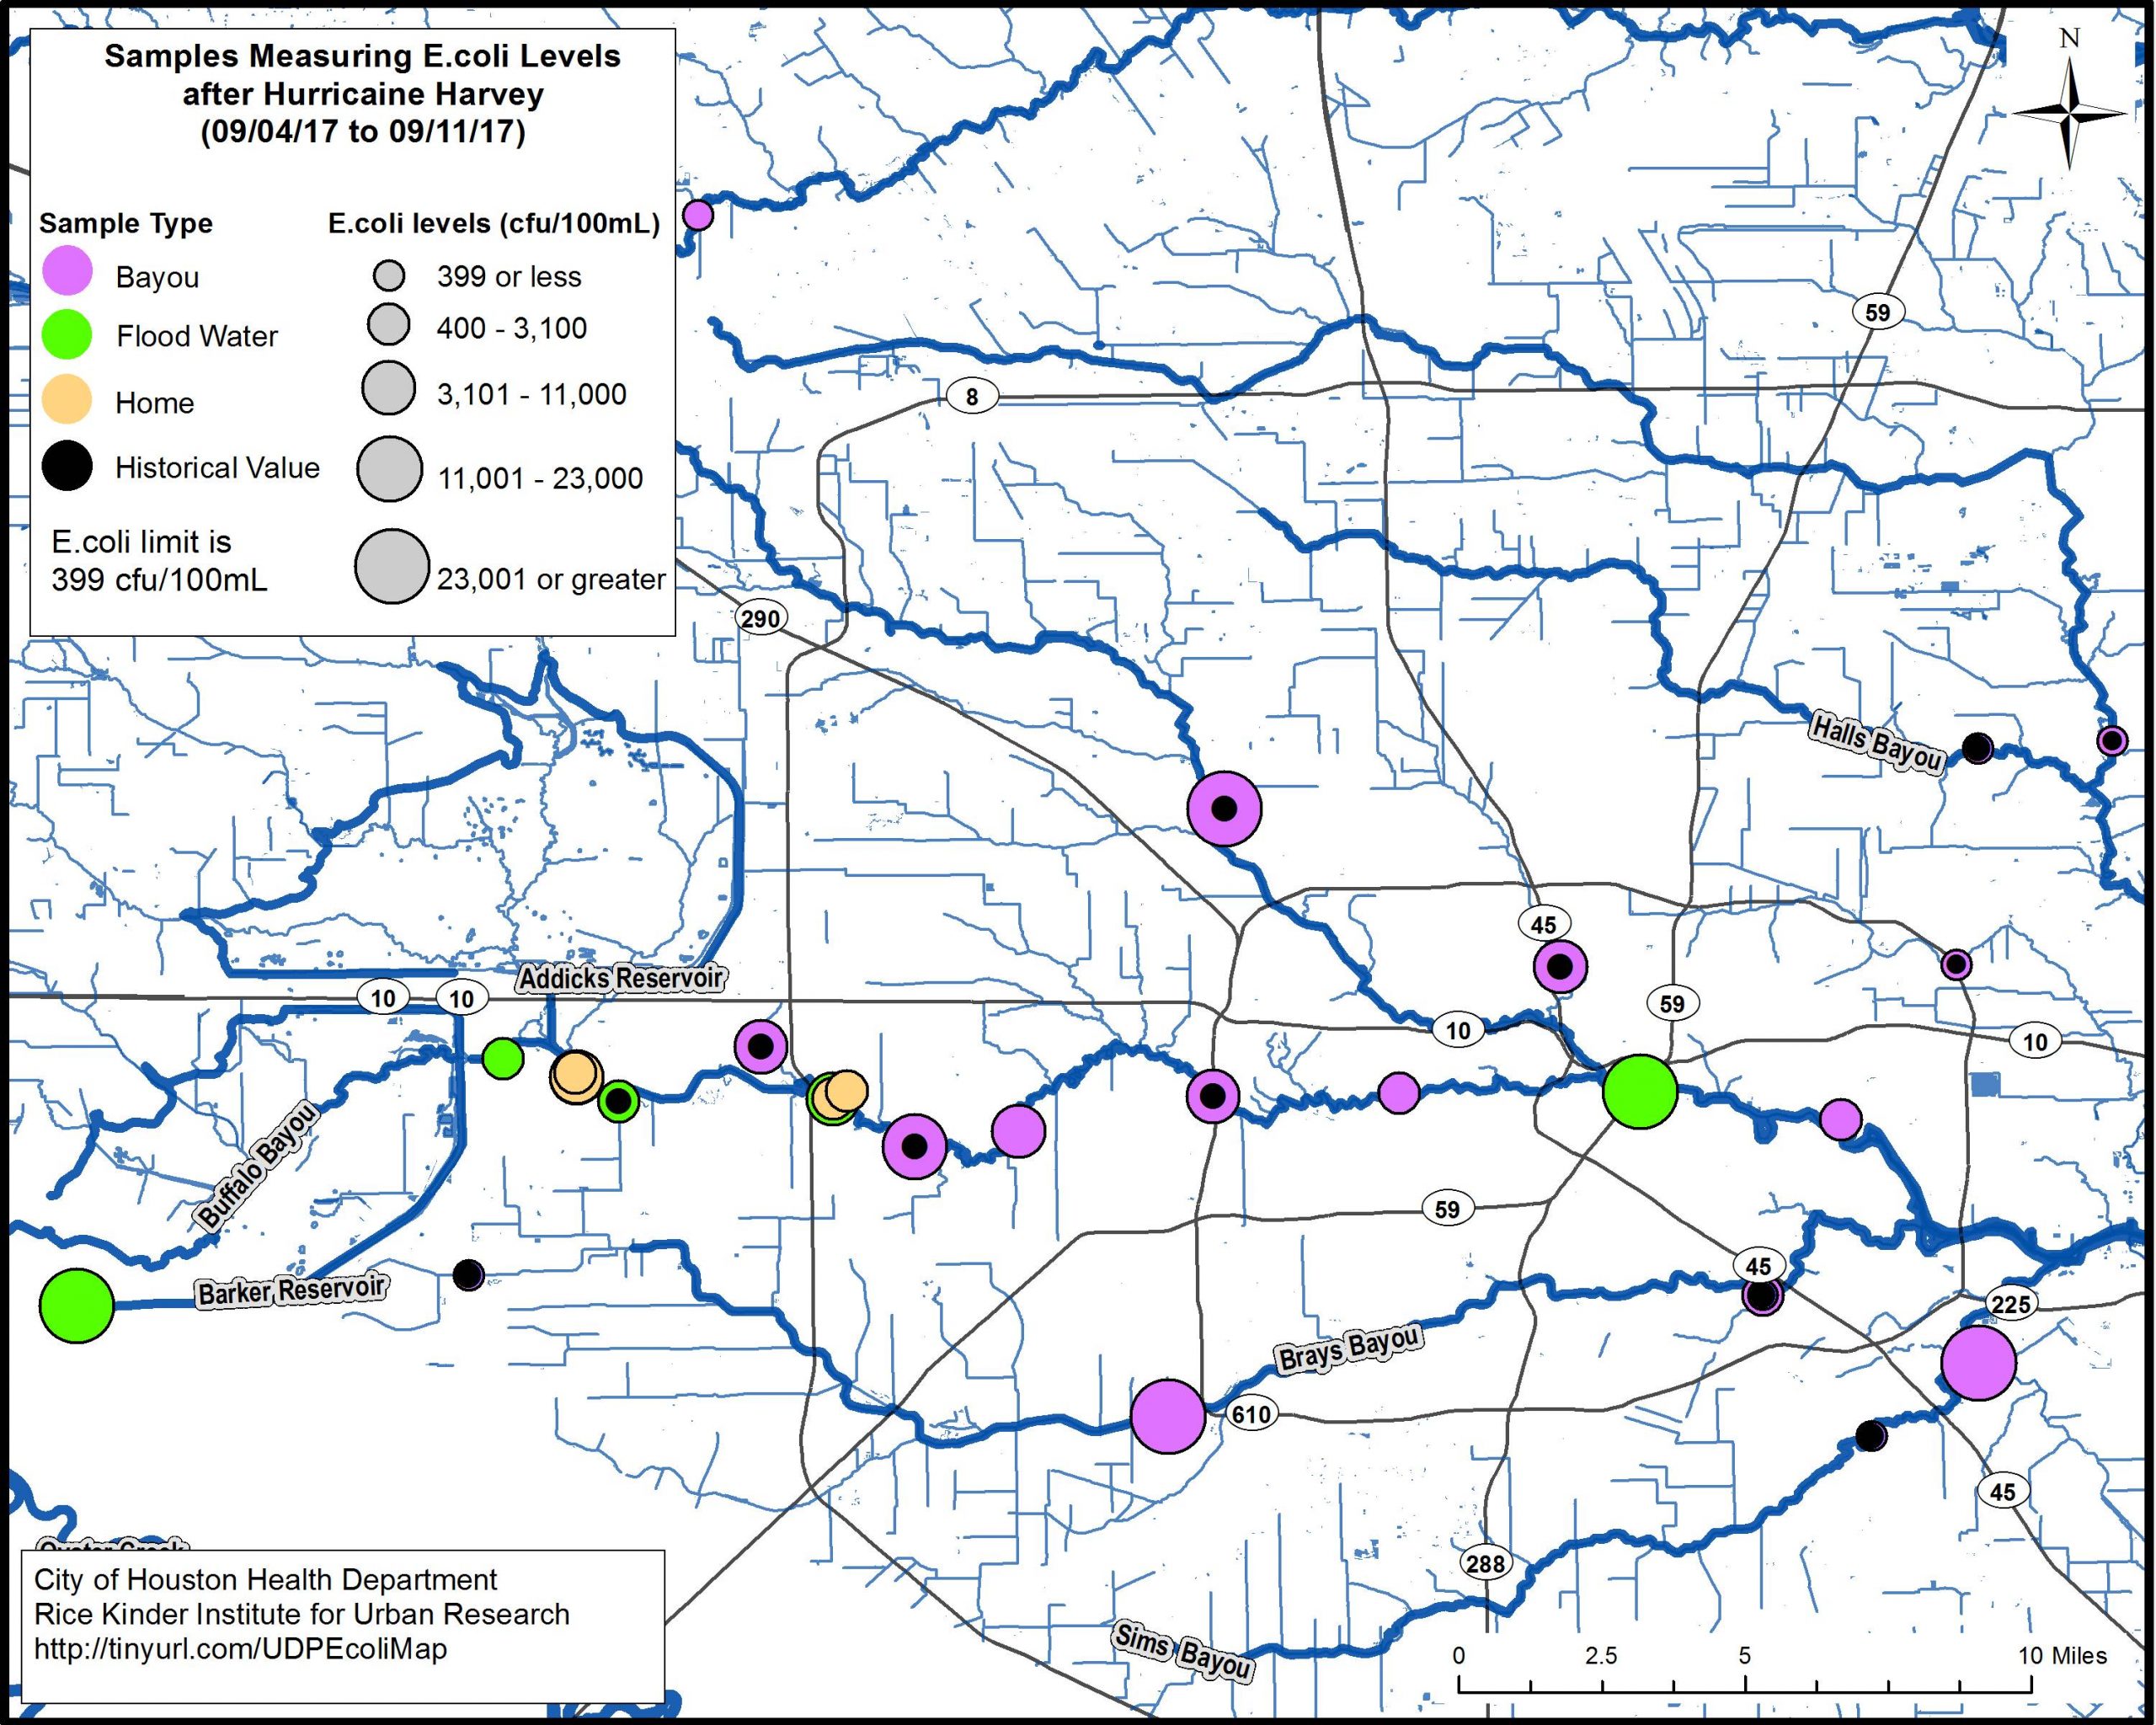
E. coli levels were much lower before Harvey (denoted by black circles), indicating the significant impact hurricanes and flooding can have on water quality. Large purple, green, and yellow circles indicate post-Harvey E. coli levels far greater than the limit set by Texas Commission on Environmental Quality (TCEQ). In some cases, contamination levels were more than 57 times above the acceptable limit. This is especially evident along Buffalo Bayou and in Southeast Houston outside the 610 Loop where levels were far above the limit (23,000 cfu/100mL or greater as opposed to the limit of 399 cfu/100mL).
Air Quality
Air pollution in the greater Houston area can worsen during major storms and hurricanes as oil refineries and chemical plants often conduct emergency shutdowns in preparation and then restart systems after the storm passes. This process involves burning excess fuels and chemicals in the pipelines which emits volumes of pollution into the air. At the same time, air quality monitoring has often been suspended in anticipation of a major storm to prevent equipment damage and can take days to get back online. This makes it difficult to track the exact amount of air pollution emitted during a storm.
Industrial facilities in Greater Houston generated an additional 340 tons of toxic air pollution during Hurricane Harvey because of shutdowns, restarts and malfunctions.9 This figure is likely an undercount since facilities self report the data and it includes only 13 of nearly 400 major industrial facilities operating in Harris and Jefferson counties, according to the Environmental Protection Agency.
Houston Advanced Research Center mapped the environmental impacts of Hurricane Harvey in 2017 and found significant increases in water and air pollution in the region.
Public Health
The cumulative effect of environmental hazards such as contaminated water and air can negatively affect one’s health immediately after a natural disaster and for an extended period of time afterward. Ingesting contaminated water can make us sick and a surge in air pollution can precipitate or aggravate respiratory conditions — or worse in more severe cases.
Not all physical health conditions that present after a natural disaster are caused by polluted water and air. Residents whose homes flood face unique hazards such as mold exposure or adverse effects sustained during clean-up activities. Mold typically grows on damp surfaces within 24 to 48 hours — and even faster in humid climates.10 Mold exposure affects everyone differently depending on the type and level, but typical symptoms include respiratory problems, nasal/sinus congestion and eye, nose, throat irritation.
After Hurricane Harvey, the Texas Flood Registry found that 63% of respondents experienced at least one negative health symptom such as runny nose, headaches/migraines, problems concentrating, shortness of breath, or skin rash. For the two storms surveyed after Harvey — the May 2019 storms and Tropical Storm Imelda — the results were less severe. Tropical Storm Imelda resulted in negative health symptoms for 9% of respondents, while 8% experienced negative health symptoms after the May 2019 storms.
Low-income communities in predominantly-Black and Latino neighborhoods are disproportionately subjected to environmental hazards and resulting public health problems.11 Communities of color and low-income residents are more likely to reside in Houston areas that flood or contain petrochemical plants because of historical discriminatory housing policies, such as redlining, among other factors.12 These neighborhoods also tend to lack effective wastewater infrastructure, exacerbating flooding risks. As more-intense storms are forecasted, health risks will only increase for Houstonians.
Mental health impacts of disasters in the Houston area
In addition to negative physical health outcomes, disasters hurt residents’ mental health.13
Nearly one-third of Harris County residents experienced negative effects on their mental health after Hurricane Harvey, according to the Episcopal Health Foundation Harvey survey.14 Black residents were most likely to report experiencing negative mental health. And individuals with lower incomes experienced more mental health distress than their higher-income counterparts. To make matters worse, only a small proportion received mental health services in the year following the storm. Latinos were least likely to receive help for mental health distress.
For recent, less intense storms, the Texas Flood Registry still found negative emotional impacts. In the three-county area, 27% of respondents to the Tropical Storm Imelda survey experienced negative emotional changes, while 20% also experienced negative mental health outcomes as a result of the May 2019 storms. An overwhelming majority of respondents in both surveys indicated that their mental health change was due to their experiences during Hurricane Harvey. In other words, mental health outcomes are tied to previous disaster experiences and have a long-term effect. Each new storm may exacerbate negative mental health outcomes from previous storms.15
The mental health impact of exposure to disasters, however, is not limited to storms. In mid-December 2021, almost two years after the arrival of COVID in Houston, more than 20% of Houston MSA residents reported that they felt nervous, anxious or on edge for at least more than half the days of a week.
Helpful Articles by Understanding Houston:
- Houston is Generous
- Houston is Resilient
- Houstonians’ Experiences with Hurricane Harvey and the COVID-19 Pandemic
- After Six Federal Disasters in Five Years, Why Do We Not Fully Prepare?
- Houston is Big
References:
- Smiley, K.T. (2020). Social inequalities in flooding inside and outside of floodplains during Hurricane Harvey. Environmental Research Letters, 15(9). https://doi.org/10.1088/1748-9326/aba0fe
- Bergstrand, K., Mayer, B., Brumback, B., & Zhang, Y. (2015). Assessing the Relationship Between Social Vulnerability and Community Resilience to Hazards. Social Indicators Research, 122(2), 391–409. https://doi.org/10.1007/s11205-014-0698-3
- National Low Income Housing Coalition. (2020). Fixing America’s Broken Disaster Housing Recovery System. https://nlihc.org/sites/default/files/Fixing-Americas-Broken-Disaster-Housing-Recovery-System_P1.pdf
- Chakraborty, J., Collins, T.W., & Grineski, S. E. (2019, February 1). Exploring the Environmental Justice Implications of Hurricane Harvey Flooding in Greater Houston, Texas. American Journal of Public Health 109, no. 2: pp. 244-250. https://doi.org/10.2105/AJPH.2018.304846
- UNC- Asheville Environmental Quality Institute. (2006, January). Assessment of Water Quality Impacts of Hurricanes in Western North Carolina Through Strategic Monitoring and Statistical Analysis (Technical Report No. 06-153). http://www.environmentalqualityinstitute.org/vwin/pdf/Hurricane-Project-EQI.pdf
Schaffer-Smith, D., Myint, S. W., Muenich, R. L., et. al. (2020). Repeated Hurricanes Reveal Risks and Opportunities for Social-Ecological Resilience to Flooding and Water Quality Problems. Environmental Science & Technology, 54 (12), 7194-7204. https://doi.org/10.1021/acs.est.9b07815 - Yu, P., Zaleski, A., Li, Q., He, Y., Mapili, K., Pruden, A., Alvarez, P. J. J, & Stadler, L. B. (2018). Elevated Levels of Pathogenic Indicator Bacteria and Antibiotic Resistance Genes after Hurricane Harvey’s Flooding in Houston. Environmental Science & Technology letters, 5, 481-486. https://doi.org/10.1021/acs.estlett.8b00329
- National Oceanic and Atmospheric Administration. (2019, February). Watersheds, flooding, and pollution. https://www.noaa.gov/education/resource-collections/freshwater/watersheds-flooding-and-pollution
- Texas Commission on Environmental Quality. (2017, December). Wastewater: Hurricane Harvey Related Sanitary Sewer Overflows and Other WW Discharges. https://www.tceq.texas.gov/assets/public/response/hurricanes/sso-ww.pdf
- U.S. Environmental Protection Agency. (2019, December). EPA Needs to Improve Its Emergency Planning to Better Address Air Quality Concerns During Future Disasters (Report No. 20-P-0062). https://www.epa.gov/sites/production/files/2019-12/documents/_epaoig_20191216-20-p-0062.pdf
- U.S. Federal Emergency Management Administration. Dealing With Mold and Mildew in your Flood Damaged Home. https://www.fema.gov/pdf/rebuild/recover/fema_mold_brochure_english.pdf
- Joint Center for Political and Economic Studies, Health Policy Institute. (2008). Environmental justice through the eye of Hurricane Katrina. https://inequality.stanford.edu/sites/default/files/media/_media/pdf/key_issues/Environment_policy.pdf
Villalón, J. (2020, September 18). Flooding Disproportionately Impacts People of Color. Bayou City Waterkeeper. https://bayoucitywaterkeeper.org/flooding-disproportionately-impacts-people-of-color/ - Flores, A. B., Collins, T. W., Grineski, S. E., & Chakraborty, J. (2020). Disparities in Health Effects and Access to Health Care Among Houston Area Residents After Hurricane Harvey. Public Health Reports, 135(4), 511–523. https://doi.org/10.1177/0033354920930133
- Stanke, C., Murray, V., Amlôt, R., Nurse, J., & Williams, R. (2012). The effects of flooding on mental health: Outcomes and recommendations from a review of the literature. PLoS currents, 4, e4f9f1fa9c3cae. https://doi.org/10.1371/4f9f1fa9c3cae
- Experienced any of the following since and as a result of Harvey: They have had a harder time controlling their temper; Their mental health has gotten worse; They started taking a new prescription medicine for problems with mental health; or Their use of alcohol increased.
- Lowe, S. R., McGrath, J. A., Young, M. N., Kwok, R. K., Engel, L. S., Galea, S., & Sandler, D. P. (2019). Cumulative Disaster Exposure and Mental and Physical Health Symptoms Among a Large Sample of Gulf Coast Residents. Journal of Traumatic Stress, 32(2), 196–205. https://doi.org/10.1002/jts.22392
Response & Recovery
$87,000 wealth gap
Disasters between 1999 and 2013 contributed $87,000 to the Black-white wealth gap in Harris County.
How we respond when natural disasters strike our region has profound effects on recovery time. Unfortunately, not everyone in Greater Houston receives the assistance and resources they need.
In this page we talk about the following:
Response to and Recovery from Disasters
Exploring how our region responds to and recovers from disasters
After disaster strikes, all levels of government, as well as the private sector, respond to provide assistance, though some in our region benefit more than others. The result is that some residents take much longer to recover, if they do at all.
Why an accessible response to disasters matters to Houston
The way in which we respond to disasters affects the total recovery time for a region and, in many cases, whether and how its most vulnerable residents recover, if at all. Many residents receive assistance from the government and have private and personal resources that enable them to make home repairs or rebuild and move on. Others are not so quick to recover, a consequence of experiencing disproportionate impacts combined with difficulty in accessing the resources necessary to rebuild their lives. The results lead to disparate recoveries both in terms of the recovery time and pathways, thereby worsening pre-existing disparities such as the wealth gap.
The more we understand the federal, local and private response and approach to disasters, the better we can identify gaps in assistance delivery for different communities and work to ensure a more equitable and timely response, so that everyone in our region not only recovers but is also made stronger.
The data
Federal response to natural disasters in the Houston area
FEMA’s Individual and Household Program
The Federal Emergency Management Administration (FEMA) addresses urgent basic needs through the Individual and Household Program (IHP), which provides financial assistance to those affected. Thousands apply, but more than half of the applications are denied. Applications that are approved receive varying amounts depending on the extent of damage and disruption, and if property is owned or rented.
The total amount in IHP assistance FEMA distributed after Hurricane Harvey in 2017 dwarfs that of other regional disasters in recent history. Residents of the three-county region received $918.2 million in FEMA disaster assistance as a result of damage from Hurricane Harvey.
FEMA’s IHP program provides assistance to homeowners to repair or rebuild their houses and funding for temporary housing. It also provides funds for owners of multifamily housing complexes, like apartments or condominiums, to fix units. Renters are only eligible for funds for uninsured or under-insured disaster-caused expenses and serious needs, such as repair of personal vehicles, funds for moving and storage, and other miscellaneous expenses approved by the government. Consequently, homeowners typically get more federal financial assistance than renters, who typically receive 64% of the IHP assistance dollars homeowners receive.
The average amount Houston homeowners in the three-county region received after Hurricane Harvey was $6,586, compared to $2,018 for renters. While FEMA paid out more for Hurricane Harvey overall than it did for other disasters, the highest average amount both renters and homeowners received in recent history was for the Memorial Day Flood in 2016. Across all disasters, Fort Bend County residents typically received more than residents of Montgomery and Harris counties.
Small Business Administration
In contrast to the direct aid of FEMA disaster assistance, the U.S. Small Business Administration (SBA) provides low-interest, long-term loans to homeowners, renters and business owners of all sizes, including nonprofit organizations, that experienced damage from a declared disaster. These loans can be used to cover operating expenses for small businesses as well as repairs and replacement of physical assets that were not previously covered through other means like insurance.
After Hurricane Harvey, the SBA issued $1.5 billion in home loans to residents in the three-county region, which is 50% more than the entire amount FEMA provided ($918.2 million). The three-county region received an additional $116.9 million in home loans for the four flood events in 2015 and 2016 combined.
Supplemental Nutrition Assistance Program
The U.S. Department of Agriculture’s Supplemental Nutrition Assistance Program (SNAP), known previously as “food stamps,” helps eligible low-income households buy food and groceries. For up to three months immediately after a declared disaster, SNAP eligibility requirements are expanded to benefit more people.
The greatest uptick in SNAP recipients occurred after Hurricane Harvey. The number of people using SNAP in Greater Houston increased by 50% — from 767,000 in August 2017 to 1,153,000 the following month. SNAP usage increased 53% in Harris County, 44% in Fort Bend County, and 6% in Montgomery County during the same time period.
National Flood Insurance Program
Possession of flood insurance alone does not necessarily translate to a quick recovery,1 but it acts as a safety net. FEMA manages the National Flood Insurance Program (NFIP) that is designed to compensate for damage from natural disasters. NFIP is the nation’s largest flood insurance program with more than 5 million policyholders nationwide. Properties located in the 100-year flood zone with mortgages from government-backed lenders are required to have flood insurance.
While properties outside FEMA’s designated 100-year flood zone are not required to get flood insurance, it is recommended, though most people are not aware of the dangers of flooding in their neighborhoods, partly because of outdated flood maps and the absence of state laws requiring landlords to disclose flooding history to renters. That’s one reason why about 80% of flood victims after Harvey did not have flood insurance. Affordability also plays a major role in whether one secures insurance — low-income households, even those who live in the 100-year flood zone are less likely to carry flood insurance. In a nationwide analysis, FEMA found that even though 41% of households are low-income, they comprise 51% of households inside the 100-year flood zone without an NFIP policy.2
More than half of NFIP policies in Texas are issued in the Greater Houston area. There are nearly half a million active insurance policies for both residential and non-residential properties in the three-county region, the vast majority of which are in Harris County. About 15-16% of Harris County residents carry flood insurance through NFIP. In high-risk areas, that climbs to 28%.3
Local response to natural disasters in the Houston area
Local government plays a large role at the beginning of the disaster recovery process. In the immediate aftermath of a disaster, local governments establish shelters, provide basic necessities, coordinate and conduct rescues, and clean up and remove debris.
Local municipalities and districts also play a large role in mitigating the effects prior to the occurrence of disasters through investments in infrastructure and the adoption and enforcement of flood plain management policies. However, a majority of residents don’t believe the local government is successful in protecting their homes from flooding.
Six months after the flooding in Houston caused by Hurricane Harvey, about 40% of people in the region rated efforts by the local government to protect homes from flooding as “poor,” according to the Kinder Institute’s 2018 Houston Area Survey. Residents in Harris County have slightly more confidence in local governments than those in Fort Bend or Montgomery counties. Additionally, nearly half of both Black (49%) and white (45%) residents in the three-county region rated local government efforts as “poor.”
Buyouts
One method local governments use to mitigate the impact of future disasters is through property buyouts. The buyout program uses federal and local dollars to purchase properties in qualifying areas that have been flooded or affected by other natural disasters multiple times. Then, the land is used as parks, green space, or flood storage or overflow. Eligible properties include single-family homes, commercial buildings, places of worship and multi-family residences, but residential properties are the highest priority. This benefit is available to property owners only. If multi-family properties are bought out, the funds go to the owners, and tenants are required to leave. The average buyout takes longer than five years4 and only one in five typically qualifies.5
Harris County has used the buyout program more than any county in the nation. Harris County Flood Control District has spent roughly $342 million to purchase about 3,100 homes since 1985, according to a 2017 ProPublica report. There are still approximately 3,300 homes on the District’s priority-buyout list, which represents about 20% of homeowners who have volunteered.
Between 1995 and 2016, 2,400 properties were bought out, according to FEMA data reported by NPR, among which nearly 90% occurred in Harris County (2,092). An additional 290 buyouts took place in Montgomery County and 18 in Fort Bend. More recent data from Harris County Flood Control District shows an additional 576 properties have been purchased and 695 buyouts are in process since 2017.
Buyouts are concentrated in areas that experience multiple floods to maximize the effectiveness of the strategy. Buyouts in Harris County have concentrated in Jersey Village (430 buyouts between 1995 and 2016), East Aldine (132), Acres Homes (130), Greenspoint (121), George Bush Intercontinental Airport (119), and Kingwood (114). Buyouts in Montgomery County have been concentrated in Conroe (158). Fort Bend used the buyout program in 2016 to convert eight properties in Simonton to vacant land.
Private philanthropic response to natural disasters in the Houston area
The public sector plays the largest role in natural disaster recovery and response, though it can take time for public dollars to trickle down to individuals. Private philanthropic dollars often support an immediate response — including filling gaps in assistance for the most vulnerable — but philanthropy can also invest in innovative models of program and service delivery.
Between 2011 and 2019, about $202.6 million philanthropic dollars have been invested in Houston’s three-county region — the vast majority went to organizations based in Harris County, according to data from Measuring the State of Disaster Philanthropy. Over the past decade, disaster philanthropy in the region peaked in 2017 and 2018, with foundations, business and individuals investing $75.8 and $82.3 million in the region, respectively.
Nonprofits in Houston that have been top recipients of disaster philanthropy between 2011 and 2019 include Attack Poverty, Fort Bend Family Health Center, and Focus Humanitarian Assistance USA in Fort Bend County; United Way of Greater Houston, BakerRipley, and Greater Houston Community Foundation in Harris County; and Connect Outreach, Missions on Wheels, and Habitat for Humanity in Montgomery County, according to data from Candid.
An analysis by the Houston Chronicle found that nearly $1 billion was donated after Hurricane Harvey — the most on record after a disaster. That includes $522.7 million by the Red Cross; $114 million by the Greater Houston Community Foundation; $100 million by the Rebuild Texas Fund; $87.5 million by the evangelical group Samaritan’s Purse; $61.4 million by United Way; $41.6 million by JJ Watt’s campaign; $30 million by the Salvation Army; and $14 million by the Center for Disaster Philanthropy. A Charity Navigator report found 5.4 million people donated $742.6 million specifically for Hurricane Harvey relief.
Slow and uneven natural disaster recovery in the Houston area
Some residents in our region are not only hit harder by natural disasters in Houston, but also receive less assistance to recover. Research indicates that federal disaster assistance policies tend to place vulnerable groups at a disadvantage and reduce their ability to access resources and assistance for natural disaster recovery.6 As a result, the many impacts of disasters can last more than several years for those with the fewest resources needed to recover. Disasters can also widen the wealth gap. Joint research between Rice University and the University of Pittsburgh found that whites accumulated more wealth after natural disasters between 1999 and 2013 while residents of color accumulated less, even after controlling for a variety of demographic and household factors.7 In Harris County, the disaster-related increase in the Black-white wealth gap averaged $87,000.
Has Houston recovered from Harvey?
Data from the Episcopal Health Foundation’s Harvey survey found that Black, low-income and immigrant families were most likely to report they were not getting the help they needed to recover after Hurricane Harvey, and the financial assistance they did receive (if any) covered “very little” or “none” of their financial losses.
About 41% of Black residents who were affected by Hurricane Harvey reported that their lives were still “somewhat” or “very” disrupted one year later, compared to 26% of white residents. Nearly one in five (17%) Harris County residents reported their overall quality of life one year after the storm is worse as a direct result of Hurricane Harvey, with Black (31%) and low-income households (20%) reporting higher levels of disruption than the region overall.
Learn about social vulnerability and the Social Vulnerability Index
Helpful Articles by Understanding Houston:
- Houston is Resilient
- Houston is Generous
- Houstonians’ Experiences with Hurricane Harvey and the COVID-19 Pandemic
- After Six Federal Disasters in Five Years, Why Do We Not Fully Prepare?
- Houston is Big
References:
- U.S. Government Accountability Office. (2017, April). Flood insurance: Comprehensive reform could improve solvency and enhance resilience. https://www.preventionweb.net/go/52896
- U.S. Department of Homeland Security, Federal Emergency Management Administration. (2018, April). An Affordability Framework for the National Flood Insurance Program. https://www.fema.gov/sites/default/files/2020-05/Affordability_april_2018.pdf
- Insurance Information Institute. (2020, June). Fact file: Texas hurricane insurance.
- NRDC. (2019, September). Going Under: Long Wait Times for Post-Flood Buyouts Leave Homeowners Underwater. https://www.nrdc.org/sites/default/files/going-under-post-flood-buyouts-report.pdf
- ProPublica and The Texas Tribune. (2017, November). Buyouts Won’t Be the Answer for Many Frequent Flooding Victims. https://features.propublica.org/houston-buyouts/hurricane-harvey-home-buyouts-harris-county/
- Urban Institute. (2020, September). Federal Disaster Policy Reforms — Including Flood Insurance Treatment—Should Center Racial and Economic Equity. https://www.urban.org/urban-wire/federal-disaster-policy-reforms-including-flood-insurance-treatment-should-center-racial-and-economic-equity/
- Howell, J. & Elliott, J.R. (2019). Damages Done: The Longitudinal Impacts of Natural Hazards on Wealth Inequality in the United States. Social Problems, 66(Issue 3), 448-467. https://doi.org/10.1093/socpro/spy016
COVID-19
More than half
of households in the Houston Metropolitan Area have lost employment income since March 13.
COVID-19 is the public health crisis of our time. In addition to the overwhelming human toll, the resulting economic crisis has had devastating impacts on our region.
In this page we talk about the following:
Coronavirus Disease 2019 (COVID-19)
Exploring how COVID-19 and its impacts have affected Houston
Beyond the human toll of COVID-19, the pandemic has caused the worst financial situation we have seen in generations. Thousands of families are struggling while also grieving the loss of loved ones.
How COVID-19 and the resulting economic crisis is affecting Houston
The novel coronavirus disease in 2019 (COVID-19) began to emerge in Greater Houston in March 2020. Since then, life in Houston — like most of the world — has been upended. Hundreds of thousands have contracted the virus, and thousands have died. Unemployment has soared to levels never before seen. The resulting health and economic crisis is ongoing, getting worse, and disproportionately affecting Black, Hispanic and low-income Houstonians.
By understanding which communities are hit hardest by the various impacts of COVID-19 we can better target resources and assistance to ensure all residents get the support they need.
The data
Note about the data
While we summarize authoritative sources on COVID-19 case and death counts for the three-county area, we’ve made an intentional effort to shed light on the broader impacts of the pandemic across a range of quality of life topics here.
The majority of data on the social and economic impacts of COVID-19 are from the Household Pulse Survey conducted by the U.S. Census Bureau. All Household Pulse Survey data presented for Houston are at the Houston Metropolitan Statistical Area (MSA) level — a statistical region delineated by the Office of Budget and Management that includes nine counties: Austin, Brazoria, Chambers, Fort Bend, Galveston, Harris, Liberty, Montgomery, and Waller counties.
This new survey began in late spring and is currently in its third phase. Phase 1 of the survey was conducted weekly and ran from April 23, 2020 through July 21, 2020. Phase 2 moved to a bi-weekly survey conducted from August 19, 2020 through October 26, 2020. Phase 3 is also conducted bi-weekly and began October 28, 2020. Due to the nature of surveys, the data may change significantly depending on the time period, which is why we offer as much historical data as possible to provide a more complete picture.
We will continue to update the site based on more recent data releases and research on how COVID-19 is affecting our region and residents.
Employment and financial impacts
COVID-19’s sweeping impacts on the nation’s economy began in March as individuals began staying at home and governments began to issue lockdowns in an effort to flatten the negative health curve. As the economy slowed, workers were laid off and production levels were cut. From the individual worker to entire industries, almost everyone was financially affected, though some more than others.
Job losses
In January and February 2020, unemployment rates in each of Greater Houston’s three counties and Texas was below four percent. Of course, unemployment peaked in April and May, 2020 — soaring to 13.0% in Fort Bend, 14.6% in Harris, and 13.2% in Montgomery counties — the highest on record. As of November 2021, unemployment rates are closer than what they were before the pandemic — 4.8% in Fort Bend, 5.1% in Harris, and 4.7% in Montgomery. November 2021 unemployment rates in the three-county region are slightly higher than they are for Texas (4.5%) and the U.S. overall (3.9%).
Unemployment insurance claims filed by individuals for the first time in the three-county region spiked late-March and early-April 2020, reaching a peak of 67,221 across the region during the week of April 4 alone. More than 1,217,400 people have filed for unemployment insurance at least once in the region between March 7, 2020 and December 18, 2021 — 136,592 in Fort Bend, 988,718 in Harris, and 92,102 in Montgomery counties.
In Year 1 of the pandemic, more than half of households in the Houston Metropolitan Statistical Area (MSA) have experienced income loss since March 13, according to March 2021 Household Pulse Survey data from the U.S. Census Bureau. That rate climbs to 64% for Hispanic, 53% for Black, and 50% for Asian Houstonians. While white Houstonians have experienced the lowest rates of job loss, about two out of five have still been affected since the beginning of the pandemic.
In Year 2 of the pandemic, about one-quarter of Houstonians report lost employment income in the last four weeks as of September 2021. Hispanic and Black Houstonians continue to report higher levels of employment income than the regional average.
In Year 1 of the pandemic, adults in lower-income households in the Houston metro area have experienced the highest rates of income loss since March 13, 2020 while those in households within the highest income group have experienced the lowest rates of income loss. In March 2021, 70% of households with annual incomes less than $25,000 have lost income compared to 21% of households that earn more than $200,000 per year. An increasingly larger share of adults in households that earn between $35,000 and $49,999 per year have reported income loss since the beginning of the survey in mid-April 2020.
Lower-income workers overwhelmingly work on the front lines of the service industry such as in retail, restaurants and bars, accommodation — the sectors with the most job losses as a result of business closures due to the virus.
In Year 2 of the pandemic, Houstonians report lower levels of lost income in the last four weeks, though the trend of the lowest-paid workers experiencing the highest rates of income loss continues.
Economic stimulus payments
The economic stimulus payments that eligible Americans received around mid-April seemed to provide a much needed boost for Houstonians. The vast majority used the money to pay for important expenses rather than add it to savings, indicating the urgency with which people need an infusion of cash.
About one out of five respondents did not receive or expect to receive the payment. Of those that did receive a stimulus payment, two-thirds of adults in the Houston metro area used stimulus checks to pay for basic needs such as food, clothing, rent, etc. A smaller proportion of the population used it to pay down debt or add to savings.
Nearly three out of 10 Hispanic Houstonians reported they did not receive or expect to receive the stimulus benefit — the highest rate among racial/ethnic groups. One possible reason for this could be that most of Houston’s undocumented population is Hispanic, and households with even one unauthorized member were ineligible for this aid — including those in mixed-status families (i.e., where some family members are U.S. citizens and others are undocumented).
In general, lower-income households were more likely to spend the stimulus check on everyday expenses. For example, 84% of adults living in households with incomes between $35,000 and $49,999 spent their stimulus checks to pay for needs such as food, shelter, and clothing. While higher-income households were the least likely to receive a check, about a quarter who did put it toward savings rather than spend it.
Difficulty paying for expenses
The unprecedented number of job losses in the region, particularly among the working poor, has further constrained families who already lived paycheck to paycheck. The result is that more and more families are having trouble paying for basic necessities.
The proportion of families struggling to make ends meet gradually increased between August 2020 and the end of the year, but has tapered down since then as we head into Year 2 of the pandemic. However, over three out of 10 Houstonians still had a “very” or “somewhat” difficult time paying for the usual household expenses in mid-December 2021.
Black and Latino households have had the most difficulty paying for expenses during the pandemic, though that figure has declined in Year 2. As of mid-December 2021, 53% of Black Houstonians and 41% of Hispanic Houstonians report “very” or “somewhat” difficulty in paying for regular household expenses, although a quarter and nearly two in five white and Asian-American households, respectively, have also experienced some difficulty.
Food insecurity
Food insecurity is most common amongst people living below the poverty line, minorities, single adults and single-parent households. Although it is closely linked to poverty, people living above the poverty line also experience food insecurity. This is particularly true during the pandemic when many more households face economic hardship due to employment and income losses and have difficulty accessing food due to fear of catching the virus and limited transportation options.
Since April 2020, about 15% of households in the region have “often” or “sometimes” not had enough to eat. Among households with children, that rate climbs to an average of 20%. Since the Census Bureau began tracking in mid-April 2020, food insufficiency for families peaked around the end of October/early November and then again in late February, likely a result of the severe winter storm that knocked out power and water for about a week for millions of Houstonians.
At mid-December 2021 in the Houston Metro Area, 15% of all households reported “often” or “sometimes” not having enough food to eat. The Houston Metro Area has had the highest rate of reported food insecurity among metros 15 times out of the 40 surveys conducted by the Census Bureau, including the one which occurred during and immediately after Winter Storm Uri in February 2021.
For households with children, food insecurity by mid-December was 15%. Almost one-quarter of Hispanic households with children were food insecure mid-December 2021 compared to 4% of white families with children.
Housing impacts
Housing costs typically comprise the biggest expense for households. When large numbers of people lose their jobs and incomes, housing vulnerability increases. Families are at a risk of falling into homelessness, among other challenges.
Rent/Mortgage Payment
The majority of Houstonians report being able to pay their rent or mortgage on time. However, homeowners are more likely to be current with housing payments than renters. Between December 1-13, 2021, about 21% of renters were behind on payments compared to 10% of homeowners. While a larger proportion of homeowners have been able to make housing payments since the beginning of the pandemic, renters appear to continue to struggle to do so. Earlier in 2020, homeowners were more likely than renters to have payments deferred, affording them extra time to pay.
Renters are more likely to be Black and Hispanic, which means these communities are disproportionately impacted by rent — and the consequences of not paying — during the pandemic.
A large proportion of Black, Hispanic and Asian Americans in Houston report not being able to pay their mortgage or rent on time. In mid-December 2021, a staggering 41% of Black renters reported not being able to pay last month’s rent compared to 3% of white renters.
Looking into the future, renters are consistently about twice as likely to have lower confidence in being able to pay the next month’s rent than homeowners. Over the last several months, an average of 40% of renters are worried about future housing payments compared to 21% of homeowners.
During the survey conducted between December 1 and December 13 2021, 41% of renters reported “no” or “slight” confidence in making next month’s payment compared to 17% of homeowners. Owners were over three times as likely as renters to expect payments to be deferred. About 45% of Hispanic, 51% of Black and 70% of Asian renters reported low confidence compared to 19% of white renters during the same time period. About 33% of Hispanic homeowners reported low confidence in making next month’s payment compared to 5% of white homeowners.
Evictions and Foreclosures
A number of local and federal efforts have been made to protect families from evictions during the pandemic. Government and private rental and direct financial assistance funds have been established and the Centers for Disease Control and Prevention (CDC) issued a moratorium on evictions. Despite these efforts, evictions have still been happening at an unprecedented rate.
Houston is among the top three cities for the most evictions during the pandemic, according to Eviction Lab. Over 57,000 evictions have been filed in Harris County alone between March 1, 2020 and December 31, 2021, according to the Evictions Dashboard created by January Advisors. Most evictions have occurred in the Greenspoint, Spring Southwest, Eldridge/West Oaks, Westchase, and Alief areas. This official figure is likely an undercount as many evictions in our region happen without a paper trail.
Families who are evicted face significant challenges. Many are forced to find subpar housing, move in with others, live in cars or go to shelters, while some end up homeless.1 This is particularly dangerous during a pandemic as overcrowding can facilitate the spread of disease. Moreover, it is nearly impossible to follow CDC guidelines regarding social distancing, staying home, and regular hand hygiene without a permanent residence.
Houston metro renters are consistently much more concerned about being evicted than homeowners are about foreclosure. In August 2021, 58% of renters who are behind on housing payments reported a high likelihood of losing their home within the next two months compared to 27% of homeowners.
Mental health impacts
COVID-19’s rapid spread and significant death count are enough to negatively impact our collective mental health. Adverse mental health crises — fear of ourselves and loved ones catching the virus, perpetual anticipatory grief — add to the invisible health toll communities are facing. The simultaneous economic crisis has caused hundreds of thousands to lose their jobs, increased the risk of homelessness, and resulted in business and individuals bearing the brunt of massive financial losses.
While public health strategies like social distancing reduce the risk of spreading the disease, they may also limit access to our social network and support system, causing feelings of loneliness.2 As a result, most Americans have experienced increased levels of anxiety and depression since the onset of the COVID-19 pandemic.3 And it’s not just adults that are affected. Children’s lives have also been disrupted. Children often lack the ability to process and the tools to adapt to changes which negatively impacts their mental health.
The proportion of adults in the Houston Metropolitan Area that have felt nervous, anxious, or on edge for at least more than half the days of a week has remained elevated in Year 1 of the pandemic, though it has ebbed and flowed as eviction moratoriums were instated and expired, the holidays came and went, and the winter storm in February 2021 exacerbated challenges.
Heading into Year 2 of the pandemic, a slightly larger proportion of adults report not experiencing anxiety symptoms. In the most recent Census Bureau survey, 22% of adults report anxiety symptoms for at least half the days of the week – similar to rates from the beginning the survey was conducted one year ago.
As previous data show, the pandemic-induced recession has hit lower-income Houstonians the hardest. This, in part, could explain elevated feelings of anxiety among those who earn between $25,000 – $75,000 per year, compared to those who earn more than six figures.
Education impacts
The way children “went to school” was transformed in the pandemic’s early months as districts and campuses moved to online learning. While the lasting impacts of the pandemic on learning and academic outcomes is still unclear, research suggests the pandemic has and will continue to severely exacerbate pre-existing opportunity gaps that put low-income students at a disadvantage relative to their better-off peers.4
According to survey data between March 17 -29, 2021 from the U.S. Census Bureau, about 37% of students in Houston MSA have spent less time on learning activities relative to before the pandemic. In this most recent survey, Hispanic and white students were most likely to report spending less time on learning. This question was discontinued by the Census Bureau after March 2021.
Higher education plans have also changed. Among adults who were planning to pursue education beyond high school, about 17% have canceled their plans and 5% will take fewer classes.
Among adults who canceled their higher education plans, 59% cite financial constraints as a reason.
Digital Divide
Even before the pandemic, consistent and reliable access to a computer and the internet was considered a modern necessity to learning. The pandemic has made it even more critical as families decide whether to send their kids back to school in-person or remain virtual. Recent preliminary research suggests online learning and teaching are effective only if students have consistent access to the internet and computers.5 Texas has made substantial efforts to reduce the digital divide among its students, and we can see that progress over time.
The most recent data from the Household Pulse Survey shows the majority of Houston children always have a computer or other digital device available for educational purposes. Hispanic and Black children typically have the lowest rates of reliable access, making virtual learning impossible and limiting their resources and technical ability. Students were more likely to report never having a device available early in the pandemic, particularly between mid-April and mid-July 2020 and in late February, possibly due to the widespread power outages resulting from Winter Storm Uri.
As of the most recent data available from the Household Pulse Survey, over 80% of students in Houston reported always having access to the internet in early July. Similar to their access to computers, children from Black households had less consistent access than their white counterparts.
COVID-19 confirmed cases
As of December 30, 2021, there have been over 814,000 confirmed cases of COVID-19 in Houston’s three-county region. There have been 98,501 cases in Fort Bend, 641,760 in Harris, and 74,038 in Montgomery counties.
From the beginning of March to mid-June, the daily case count in Harris County stayed below 400 per day. However, at the end of June cases began to rise. This increase coincides with what many reports have called the “Memorial Day spike” (a sharp increase in cases associated with holiday-weekend activities). It also coincides with the State of Texas’s order to allow restaurants to open at 75% capacity — previously, restaurants were open at half capacity. The next major increase occurred from September 20-22 was a result of a delay in counting backlogged cases, according to the New York Times. Cases in Harris County were on a steady rise from October 3, 2020 to January 14, 2021 and have been declining since.
Fort Bend County also experienced a spike around June 15, as cases started rising at a higher rate, although the increase wasn’t as rapid as it was for Harris County. Fort Bend saw a sharp increase around August 3, due to the addition of backlogged cases to the tally. As with Harris County, cases in Fort Bend County were also climbing steadily in September, 2020 peaking in December and have been declining since mid-January 2021.
Montgomery County witnessed its steepest increase in COVID-19 cases between early June and mid-July. Positive cases have been fluctuating since. Montgomery County also saw a steady rise in COVID-19 cases in mid-November which started declining the beginning of February 2021.
Cases per 100,000 Residents
Between March 4, 2020 and December 30, 2021, Texas recorded 13,032 COVID-19 cases per 100,000 residents. Within the three-county region, Harris County leads with 13,616 cases per 100,000 residents. Fort Bend and Montgomery counties recorded 12,135 and 12,190 cases per 100,000 residents, respectively.
COVID-19 deaths
COVID-19 deaths have also been on the rise in Houston’s three-county region, where 11,919 people have died from COVID-19 as of December 30, 2021, including 1,006 deaths in Fort Bend, 9,772 in Harris, and 1,141 in Montgomery counties.
Deaths per 100,000 Residents
Texas has recorded 258 deaths per 100,000 residents due to COVID-19 between March 4, 2020 and December 30, 2021. In the greater Houston area, Harris County has recorded 207 deaths per 100,000 residents. Fort Bend and Montgomery Counties have recorded 124 and 188 deaths per 100,000 residents, respectively.
COVID-19 Deaths by Race/Ethnicity
Overwhelming evidence supports the fact that Black, Hispanic and Indigenous people are contracting — and dying from — COVID-19 at a much higher rate than whites. While the virus seemingly doesn’t discriminate, underlying socio-economic factors and existing patterns of inequality contribute to the virus disproportionately impacting these racial and ethnic groups.
Black and Hispanic populations are more susceptible to dying from COVID-19 because they disproportionately work on the front lines, have lower access to health care, historically live in poor-quality environments, and tend to have a higher prevalence of preexisting conditions.
In simple terms, if the virus were to affect everyone in relatively similar ways we would expect each group’s proportion of cases and deaths to be comparable to their share of the overall population. However, that’s not what is happening — we see significant disparities in who is succumbing to the virus.
For example, while Hispanics make up 25% of Fort Bend County’s population, they comprise over 32% of the county’s COVID-19 deaths.
A similar pattern exists in Montgomery County. While Black residents make up about 5% of the county’s population, they comprise over 10% of all COVID-19 deaths.
In Fort Bend County, Hispanic Houstonians are dying from COVID-19 at the highest rates. COVID-19 deaths per 100,000 Hispanic residents in Fort Bend County is 107 per 100,000 Hispanic residents. COVID-19 deaths per 100,000 Black residents in Montgomery County is 403 per 100,000 Black residents — over twice the rate among whites in the county.
Vaccines
Vaccines started rolling out in mid-December 2020. Official vaccination figures tracked by Texas Department of State Health Services data are below.
As of January 3, 2022, 83% of Fort Bend County’s eligible population (5 years of age and older) has received at least one vaccine, with 73% being fully vaccinated. Vaccination rates in Harris and Montgomery counties are lower in comparison, with 64% and 57% of the eligible population fully vaccinated, respectively. However, not all residents have equal access to vaccines.
As of January 3, 2022, Asian Americans have the highest vaccination rates across all three counties and the state of Texas. Black residents are vaccinated at the lowest rates in Harris County as well as the state of Texas while white residents are vaccinated at the lowest rates in Fort Bend and Montgomery counties.
While income data on who has been vaccinated is not publicly available, we can use survey data from the U.S. Census Bureau to understand general trends. It is important to note these are not official vaccination rates.
Vaccination rates tend to correlate with income level as well. The higher a household’s income, the more likely they are to have been vaccinated. According to estimates from the most recent Household Pulse Survey, about 72% of adults in households that earn less than $25,000 per year have received a vaccination compared to 85% of households that earn more than $200,000 annually. Vaccination rates for all groups appear to have increased since the beginning of 2021.
Houston-area residents give a number of reasons for not receiving or planning to receive a COVID-19 vaccine. According to surveys conducted in December the top three reasons for this are concerns over potential side effects (45%), residents don’t trust the COVID-19 vaccines (42%), and wanting to wait and see if it is safe (37%).
References:
- Collinson, R., & Reed, D. (2018). The effects of evictions on low-income households. https://economics.nd.edu/assets/303258/jmp_rcollinson_1_.pdf
- Kaiser Family Foundation. (2020, August 21). The Implications of COVID-19 for Mental Health and Substance Use. https://www.kff.org/coronavirus-covid-19/issue-brief/the-implications-of-covid-19-for-mental-health-and-substance-use
- Pfefferbaum, B., & North, C. S. (2020). Mental Health and the Covid-19 Pandemic. New England Journal of Medicine, 383(6), pp. 510–512. https://doi.org/10.1056/nejmp2008017
- García, E., & Weiss, E. (2020). COVID-19 and Student Performance, Equity, and US Education Policy: Lessons from Pre-Pandemic Research to Inform Relief, Recovery, and Rebuilding. Economic Policy Institute. https://www.epi.org/publication/the-consequences-of-the-covid-19-pandemic-for-education-performance-and-equity-in-the-united-states-what-can-we-learn-from-pre-pandemic-research-to-inform-relief-recovery-and-rebuilding/
- Ibid
- Boehmer TK, DeVies J, Caruso E, et al. (2020, May–August). Changing Age Distribution of the COVID-19 Pandemic — United States, 15(9). MMWR Morb Mortal Wkly Rep 2020;69:1404–1409. http://dx.doi.org/10.15585/mmwr.mm6939e1