Understanding environment amid a changing climate in Houston
How our region’s air and water quality and climate change impacts affect our environment, health and future well-being
Fundamental to our existence are clean air, potable water, and temperatures being “just right” on Earth. And while eight billion people share this planet, most environmental impacts are felt locally — and unevenly. Despite improvement in air and water pollution levels in Houston’s three-county region over the last two decades, historically marginalized and low-income communities continue to bear a disproportionate burden and risk of an unhealthy environment. Nationally, those from marginalized communities are over three times more likely to be breathing the most polluted air than white people.
Contaminated air and water poses serious health threats for residents and the environments they live in. Compounding these health effects, Houston is hotter and wetter than it was a decade ago. Our location, topography, and climate make us particularly vulnerable to climate change and extreme weather conditions which will continue to occur at greater intensities and with more frequency. The cumulative effects of climate change could potentially displace millions of people and threaten our economic output.
The more we know about our local air and water quality and how climate change will continue to impact our region, the more we can do to make the adjustments necessary for a more livable future, particularly for our residents who bear the greatest risks.
Vote for what matters to you
What issues do you think need attention, resources, and collaborative action?
69 votes
There are two subtopics for
environment in Houston
Air & Water Quality
26th out of 56
Texas ranks 26th highest out of the 56 states and territories nationwide for the amount of toxic chemicals released per square mile.
The presence of pollution and harmful toxins in our air and water has a significant impact on public health. While the Houston area is slowly recovering from its reputation as a smog capital, much work remains to be done.
In this page we talk about the following:
Air and Water Quality
Air and water quality has improved over the last couple decades but remain at levels that can harm public health, particularly the most vulnerable.
Despite improvement in water and air pollution levels in Houston’s three-county region over the last two decades, People of Color and low-income communities continue to bear a disproportionate burden of an unhealthy environment.
Why air and water quality matters to Houston
Nothing is more essential to sustaining life than air and water. Houston used to be known as the nation’s smog capital in the 1990s, but the region has made significant strides since then to clean its air. However, air pollution levels caused by growing industries, heavy traffic and a car-dependent culture remain a persistent problem for the Houston region. Additionally, the Houston area has vast water resources, including a great number of major rivers and streams running across the state that support our region. These water resources support both natural ecosystems and human habitation. However, in highly-developed urban areas — particularly those accustomed to flooding like the Houston region — urban waterways take on concentrated pollution from industrial discharges, vehicles, residential and commercial wastewater, trash and polluted stormwater runoff.
Contaminated air and water poses serious health threats for residents and the environments they live in. High levels of ozone and particle population have been found to lead to premature death and other health conditions like respiratory illnesses, cancer, asthma attacks, cardiovascular damage, and developmental and reproductive damage.1 Across the U.S., about 50,000–100,000 excess deaths are attributed to air pollution.2 And contaminated water can lead to illnesses and even cause death. What’s more, our most vulnerable residents — people of color, low-income communities, young children, and older adults — tend to be disproportionately affected by environmental hazards, both in terms of higher exposure levels and more severe health outcomes.3 4
The more we know about Greater Houston’s air quality and water quality, particularly in our region’s most vulnerable communities, the better equipped we are to take informed action in order to protect these essential resources for future generations.
The data
Ozone, particle pollution and toxic waste releases contribute to poor air quality in urban areas
Though improving, high ozone levels still undermine public health in the Houston area
Ozone can be “good” or “bad” depending on where it is found in the atmosphere. Stratospheric ozone is “good” because it occurs naturally in the upper atmosphere and protects living things from harmful ultraviolet radiation from the sun. “Bad” ozone is found at the ground level and is often called “smog.” Ozone can cause immediate breathing problems and is associated with many negative health outcomes, including asthma and even premature death.5
Ground-level ozone is not emitted directly into the air. Instead, it is formed when heat and sunlight cause chemical reactions between oxides of nitrogen (NOx) and volatile organic compounds (VOC). These chemicals are produced primarily from cars and industrial processes. Since ozone is most likely to reach unhealthy levels on hot days in urban areas, typically the ozone readings reach the highest values between April and September in the region.
In December 2020 the National Ambient Air Quality Standards for ground-level ozone were set at 0.070 parts per million (ppm) averaged over an 8-hour period. This is the same standard that was set in 2015 and is lower than the 2008 standard of 0.075 ppm.
Since 2000, there has been a significant decrease in the number of days in which ozone levels were above EPA standard in our region. Harris County saw the number of days above standard fall 64%, from 70 days in 2000 to 25 in 2018. Montgomery County saw a similar decrease of 77%, from 47 days in 2000 to 11 in 2018.
While Houston has experienced long-term progress, data from recent years show a modest uptick in the number of days where ozone levels were dangerously above standard. Harris County saw the number of days above standard increase from 17 days in 2016 to 25 in 2018, while Montgomery saw an increase from 4 days in 2016 to 11 in 2018. Across the U.S., ozone levels have not decreased at the rate they were previously indicating stalling progress on improving air quality.6 Ozone levels in Greater Houston also remain high compared to the rest of the country, according to the most recent State of the Air report by the American Lung Association, which rated the ozone levels in Harris and Montgomery as an “F.”
The amount of particulate matter in Houston’s three-county region is below national standards but remains higher than national rates
Particle pollution, or particulate matter (PM), refers to small solid and liquid particles, like soot, found in the air. These particles are released into the air by different industrial processes, fires, dust, or formed from vehicle exhaust. While these particles are so microscopic they cannot be detected individually, when millions are present, they can reduce visibility and cause haze.
Particles less than 2.5 micrometers in diameter are referred to as PM2.5, and because of their size, they are easily inhaled by humans. In 2019, the EPA determined that both short-term and long-term exposure to PM2.5 causes early death.7 PM2.5 particles pose the greatest risk to health through cardiovascular and respiratory diseases, and vulnerable populations, including children and older adults, have higher chances of being affected.
In December 2020, the U.S. Environmental Protection Agency (EPA) decided to retain the 2012 National Ambient Air Quality Standard for PM2.5 at the annual average level of 12 micrograms per cubic meter of air (µg/m3) for another five years. However, in June 2021 the EPA announced it would reexamine the standard, given the scientific evidence of the harm to people’s health. It expects to have a final rule in Spring 2023.
Does Houston have good air quality, as measured by particle pollution? In the Houston Metropolitan Statistical Area (MSA), the annual average concentration of PM2.5 has decreased from 13.1 µg/m3 in 2000 to 10.1 µg/m3 in 2020. This represents a 23% improvement in air quality. While this indicates progress, the reduction of air pollution in Houston has not kept up with the national trend, where PM2.5 levels fell 41% during the same time period.
As with ozone levels, there has been a leveling off of improvement in particulate matter pollution in recent years.8 This trend is also seen across the U.S and Europe and reflects the challenges to reducing PM2.5 concentrations at lower levels, even with the enforcement of long-term policies like the Clean Air Act.9
Levels of contamination in Houston-area drinking water and water bodies remain a public health concern
Clean and safe drinking water helps prevent illness, birth defects and even death.10 To ensure the water is safe for human consumption, public water systems are frequently checked to verify that the levels of contaminants present in the water do not exceed the Maximum Contaminant Levels set by the EPA. As of July 01, 2021, Texas regulates 7,053 public water systems, providing drinking water to more than 29.5 million customers.
Water violation levels threaten the safety of Houston’s drinking water
According to the Safe Drinking Water Information System (SDWIS) federal reporting system, Harris County had a total of 1,595 drinking water violations reported from its active facilities in 2020. It had the most drinking water violations among the three counties, but it is difficult to determine the exact population impacted by each violation. Fort Bend and Montgomery counties have fewer water violations reported. Additionally, not all violations are equivalent; testing date, frequency and location can also affect the detection and severity of violations.
The majority of area water sources are bacteria-impaired
Ground and surface refer to the naturally occurring water sources beneath and above the Earth’s surface, respectively. While about 80% of the groundwater in Texas is used for agricultural purposes, mostly for irrigation, the Houston region also relies on groundwater for domestic and industrial usage.
When a water source becomes polluted or otherwise contaminated, it is considered to be impaired. In heavily populated areas like Houston, the most common contaminants of groundwater come from petroleum storage tank facilities.
What does this mean for Greater Houston’s water quality? Overall, 67% of the water streams found in the three-county area are currently impaired because of bacterial contamination, making their water unsafe. When bacteria concentrations in the water are too high, people swimming, fishing or boating in the water can become ill if they ingest the water. Some of the most common contributors of bacterial contamination are malfunctioning wastewater treatment plants, sanitary sewer system overflows, and failing onsite sewer facilities and septic systems. Severe storms and flooding can also exacerbate contamination in regional waterways, particularly in regions accustomed to flooding.
Continue reading about flooding in Houston
Harris County has the most miles of impaired streams, about 530 miles in total, compared to 227 miles in Montgomery County and 48 in Fort Bend County. As a percentage of all stream miles, Harris County and Fort Bend have a higher proportion of contaminated streams (71% and 72%, respectively) than Montgomery County (59%). More miles are impaired in Fort Bend and Montgomery counties today than a decade ago with levels in Harris County relatively flat.
Toxic chemicals can be found in our air, water, and land, affecting our collective health
What causes water pollution, other than bacteria? Toxic chemical waste released by industrial facilities also greatly affects Greater Houston’s water quality. In the U.S., industrial facilities that meet certain criteria must report the amount of chemicals that are released into the environment. This information is released to the public through the EPA’s Toxic Release Inventory (TRI). Not all toxic chemicals used in the U.S. are reported. However, TRI does monitor those that may pose a threat to human health and the environment. As of 2021, the TRI chemical list included 770 individual chemicals and 33 chemical categories.
Houston’s three-county region releases a smaller share of chemical waste into the environment than Texas and the nation
Toxic waste from facilities can be managed in different ways. According to the EPA, the preferred management method is recycling, followed by energy recovery, treatment, and as a last resort, disposing or releasing the waste to the environment.
In 2019, Texas ranked 26th highest out of the 56 states and territories nationwide for total on-site and off-site disposal or other releases per square mile. Both Houston’s three-county region (25.9%) and Texas (24.4%) recycle about one-fourth of its toxic chemicals, compared to the national rate of 53%. However, Texas releases a smaller share of these toxic chemicals into the environment. In Texas, 192 million pounds (or 5%) of production-related waste was disposed of or released into the environment. For comparison, the U.S. released 11%.
At a local level, while Harris County released more total waste (46 million pounds) than Fort Bend (2.7 million pounds) and Montgomery (0.7 million pounds) counties, Harris County released a smaller proportion of that waste (3.5%) into the environment. Montgomery County released 12.7% and Fort Bend released 27.3% of its waste into Houston’s environment.
Despite a reduction in chemical releases, millions of pounds of toxic chemicals are released into our environment
A “release” refers to different ways that toxic chemicals from industrial facilities enter the air, water and land. Releases include spilling, leaking, pumping, pouring, emitting, emptying, discharging, injecting, escaping, leaching, dumping, or disposing into the environment. In Texas, of the 158.7 million pounds of toxic chemicals disposed of or released on-site, 57% was disposed of on land, 32% emitted into the air, and 11% was released into the water.
The amount of toxic chemicals industrial facilities released on-site in Houston’s three-county region has declined significantly in the last 15 years. Between 2005 and 2019, the three-county Houston area has reduced the amount of toxic chemicals released on-site by 23.4% from nearly 50.1 million pounds to 38.8 million pounds, respectively. The greatest reductions were seen in the levels released into the air (41.0%) while the amount released in water increased about 10.3% during the same time period. Fort Bend reduced its on-site chemical releases 40.4% between 2005 and 2019 with the substantial reductions across air, water, and land. Toxic chemicals released on site fell 21.5% in Harris County and 62.1% in Montgomery County during the same time period.
More recently, Fort Bend released 2.1 million pounds of toxic chemicals on-site in 2019, with 1.5 million pounds placed in some type of land disposal and 650,000 pounds released into the air. Montgomery had 796,000 pounds of chemicals that were not recycled, recovered, or treated in the same year. Of those, 527,000 pounds were disposed off-site, while 268,000 pounds were emitted on-site into the air. For Harris County, of the 46.6 million pounds of waste either being disposed of or emitted, 22 million pounds were disposed of on land, 10.6 million pounds were released into the air, and 3.6 million were released into water.
Read about renewable energy and climate change in Houston
People of Color are disproportionately impacted by air, water, and land pollution
Black and Hispanic residents are more likely to live in areas with a higher exposure to air, water, and land pollution than white Americans.11 Recent research has also shown that while white Americans cause more pollution through consumption, non-white populations suffer more from that pollution.12
The Department of Energy defines environmental justice as “the fair treatment and meaningful involvement of all people, regardless of race, color, national origin, or income, with respect to the development, implementation, and enforcement of environmental laws, regulations, and policies.” More succinctly, environmental justice refers to the principle that all people should have access to clean and healthful environments and that the burdens of pollution are not carried by only certain groups. To promote transparency of this issue, the EPA developed EJSCREEN—a publicly-available tool that shows where environmental burdens may not be shared equally.
As part of the EJSCREEN toolkit, EPA created 11 EJ indexes. Each index looks at a single environmental factor and combines it with a demographic component to understand the “excess environmental risk” faced by People of Color and low-income individuals. EJSCREEN allows for comparisons of a community to the rest of the state, EPA region, and nation, by using percentiles. A percentile is a relative term, and tells us how an area’s performance compares to a particular group (e.g., other counties in Texas, other counties in the U.S.). So, a county with a percentile of 80 on a particular EJ Index means that the county has higher risk on that environmental factor given its demographic composition than 80% of other counties in Texas (or the nation, depending on the comparison).
When compared to the rest of the state, Fort Bend and Harris counties are worse than the median in each of the five air-quality measures, meaning they’re worse not only because of Houston’s air quality itself, but also because of the racial inequality in exposure to those hazards compared to other counties in Texas. Fort Bend County performs worse than 71% of other counties in Texas on particulate matter (both the levels and the excess risk borne by People of Color and low-income communities). However, when compared to the nation, Fort Bend County performs worse than 86% of counties. While Montgomery County performs better than most other Texas counties on the same measures, Montgomery County has the least racial/ethnic diversity among the three Houston-area counties which affects its score.
Similar trends emerge for EJ indexes that focus on waste and water quality. Proximity to superfund sites on the National Priorities List (NPL) is higher for all three counties compared to the rest of the state and nation. Fort Bend and Harris also have higher environmental justice issues surrounding hazardous waste facilities and sites that use certain flammable and toxic substances, also known as Risk Management Plan sites. One area where all three counties in the region perform better than other counties in Texas and the U.S. is in wastewater discharge.
EJSCREEN also produces maps that show which block groups have disproportionate risk to unhealthy environments. The higher the percentile, the higher the environmental harm to People of Color and low-income populations relative to the state (or nation).
Helpful Articles by Understanding Houston:
- Houston is Hot
- Examining the Effects of Environmental Inequity in Houston
- Four Facts About Houston’s Environment That Every Resident Should Know
- The State of Water Quality in Houston: Four Stats Every Resident Should Know
- Examining Houston’s Reputation as a Car City
References:
- U.S. Environmental Protection Agency, “Ground-level Ozone Pollution – Health Effects of Ozone Pollution,” last modified May 5, 2021.
- U.S. Environmental Protection Agency, Air Quality Criteria For Ozone And Related Photochemical Oxidants (Final Report, 2006), by the U.S. Environmental Protection Agency (EPA/600/R-05/004aF-cF), Washington, DC, 2006. Web.
- Bullard, R. D. (1983). Solid waste sites and the black Houston community. Sociological inquiry, 53(2‐3), 273-288.
- Bullard, R. D. (Ed.). (1993). Confronting environmental racism: Voices from the grassroots. South End Press.
- U.S. EPA. Integrated Science Assessment (ISA) for Ozone and Related Photochemical Oxidants (Final Report, Apr 2020). U.S. Environmental Protection Agency, Washington, DC, EPA/600/R-20/012, 2020.
- Zhe Jiang, Brian C. McDonald, Helen Worden, John R. Worden, Kazuyuki Miyazaki, Zhen Qu, Daven K. Henze, Dylan B. A. Jones, Avelino F. Arellano, Emily V. Fischer, Liye Zhu, K. Folkert Boersma. “Unexpected slowdown of US pollutant emission reduction in the past decade.” Proceedings of the National Academy of Sciences, 2018; 201801191 DOI: https://doi.org/10.1073/pnas.1801191115
- U.S. EPA. Integrated Science Assessment (ISA) for Particulate Matter (Final Report, Dec 2019). U.S. Environmental Protection Agency, Washington, DC, EPA/600/R-19/188, 2019.
- Clay, K., Muller, N. Z., & Wang, X. (2021). Recent increases in air pollution: evidence and implications for mortality. Review of Environmental Economics and Policy, 15(1), 154-162.
- Shaddick, G., Thomas, M.L., Mudu, P. et al. Half the world’s population are exposed to increasing air pollution. npj Clim Atmos Sci 3, 23 (2020). https://doi.org/10.1038/s41612-020-0124-2
- Craun, Gunther F., et al. “Causes of outbreaks associated with drinking water in the United States from 1971 to 2006.” Clinical Microbiology Reviews 23, no. 3 (2010): 507-528.
- Brulle RJ, Pellow DN. “Environmental justice: human health and environmental inequalities.” Annu Rev Public Health. 2006; 27:103-24. doi: 10.1146/annurev.publhealth.27.021405.102124. PMID: 16533111.
- Tessum et al., “Inequity in Consumption of Goods and Services Adds to Racial–Ethnic Disparities in Air Pollution Exposure.” PNAS March 26, 2019 116 (13) 6001-6006; https://doi.org/10.1073/pnas.1818859116.
Renewable Energy & Climate Change
500 days with temperatures over 95°F
Montgomery County had more than 500 days with temperatures over 95°F between 2010 and 2020 compared with fewer than 300 days in the previous decade.
Houston is hotter and wetter than it was a decade ago, and our proximity to the Gulf of Mexico increases our region’s vulnerability to the effects of climate change. One area of continued progress: Texas is at the forefront of renewable energy production in the U.S.
In this page we talk about the following:
Renewable Energy & Climate Change in Houston
As our region continues to experience the effects of climate change, the role of renewable energy sources grows more important.
While current greenhouse gas emission levels in Greater Houston have remained flat in the last decade, our region has become hotter and wetter. Climate change risks are projected to increase in the future, posing threats to Houstonians’ health and prosperity.
Why climate change and renewable energy matters to Houston
Climate change is generally understood to be a series of changes in our global weather, oceans, and ecosystems, and that these changes are due to a buildup of greenhouse gases in our atmosphere that cause the planet to warm. Ninety-seven percent of climate scientists have published research finding that man-made factors are causing average temperatures to rise. This warming means more people will continue to die from heat, particularly older adults and young children; we will experience more frequent, intense, and destructive storms due to warming oceans; increased flooding in coastal communities from rising sea-levels; and could potentially destroy flora and fauna species.
While some believe the effects of climate change in Houston may not be this disastrous, many experts predict that climate change will cause displacements and force migrations as people flee hardest-hit regions, the Gulf Coast being one of them.1 Because of its proximity and size, the Houston region could be a prime destination for displaced folks leaving flooded low-lying coastal areas.2 The 2018 National Climate Assessment estimates that the U.S. economy could shrink by 10%,3 and the three-county region’s GDP could contract between 6-7% because of the effects of climate change.4 While transitioning to renewable energy from fossil fuels isn’t the only solution to combating the effects of climate change,5 it is believed to help.
The more we understand how our region contributes to climate change and how it impacts our residents — particularly the most vulnerable6 — the more we can do to make the improvements and adjustments necessary for a more livable future, particularly for our most vulnerable residents.
The data
Greenhouse gas emissions in the three-county region remain flat
Gases that trap in heat from the sun are called greenhouse gases (GHGs). Many chemical compounds act as greenhouse gases and, without naturally occurring ones, the earth would be too cold to support life as we know it. However, since the Industrial Revolution began 150 years ago, human-caused greenhouse gas emissions emissions have increased, with the rate of growth accelerating dramatically starting in the 1950s. The change in the concentration of GHGs in the atmosphere has resulted in more heat being trapped on Earth. This has caused the Earth’s average temperature to increase, a phenomenon known as climate change.
The main greenhouse gases include carbon dioxide (CO2), methane (CH4), nitrous oxide (N2O), and fluorinated gases (e.g., hydrofluorocarbons caused by industrial processes). While ozone is technically a greenhouse gas, it is not included in either U.S. or international GHG counts because its protective benefits in the stratosphere outweigh its contribution to the greenhouse effect. In 2019, carbon dioxide accounted for 80% of the greenhouse gas emissions in the U.S. Burning fossil fuels, like coal, natural gas and oil, is the main contributing factor to the high releases of CO2 into the atmosphere.
Greenhouse gases are emitted from a variety of different industries and uses. Fossil fuels used to generate electricity and produce industrial goods account for 48% of greenhouse gas emissions in the U.S. The U.S. Environmental Protection Agency (EPA) reports facility-level GHG data from major industrial sources across the U.S. through its Greenhouse Gas Reporting Program (GHGRP).
In 2019, large direct-emitting facilities (e.g., industrial plants) in the U.S. produced 2,850 million metric tons (MMT) of GHG emissions. Facilities in Texas produced 380 MMT of GHG emissions in 2019. This represents 13% of all GHG emissions for the entire nation, which is more than double that of any other state’s emission level.
In the three-county Houston region, facility-level greenhouse gas emissions totaled 67.9 MMT in 2019, essentially flat from 67.5 MMT in 2011. In 2019, Harris County produced 52 MMT of GHG emissions, accounting for over 75% of the region total; Fort Bend released 14 MMT, lower than the amount emitted in 2011; and Montgomery emitted 1 MMT.
While the industrial and energy sectors produce large amounts of greenhouse gases, the transportation sector is the largest contributor to GHG in the U.S. — it accounts for 29% of all GHG emissions. In general, driving-related emissions for households living in location-efficient urban neighborhoods (typically characterized by walkable streets, easy access to transit, proximity to jobs, mixed land uses, and concentrations of retail and services) are half or less of what they are for households in the least-efficient, car-dependent neighborhoods. According to C40 Cities, a network of international megacities committed to addressing climate change, the city of Houston transportation sector alone produced 17 MMT of greenhouse gas emissions in 2019.
Continue reading about Houston’s air quality and water quality
Houston’s environment is hotter and wetter than it was a decade ago
Ninety-seven percent of actively-publishing climate scientists agree that climate-warming trends are extremely likely due to human activities, primarily the burning of fossil fuels. Most of the warming that scientists have observed has occurred in the past 40 years, with the seven most recent years being the warmest. The years 2016 and 2020 are tied for the warmest year on record. And, as the climate continues to warm, the chance for extreme weather increases.7
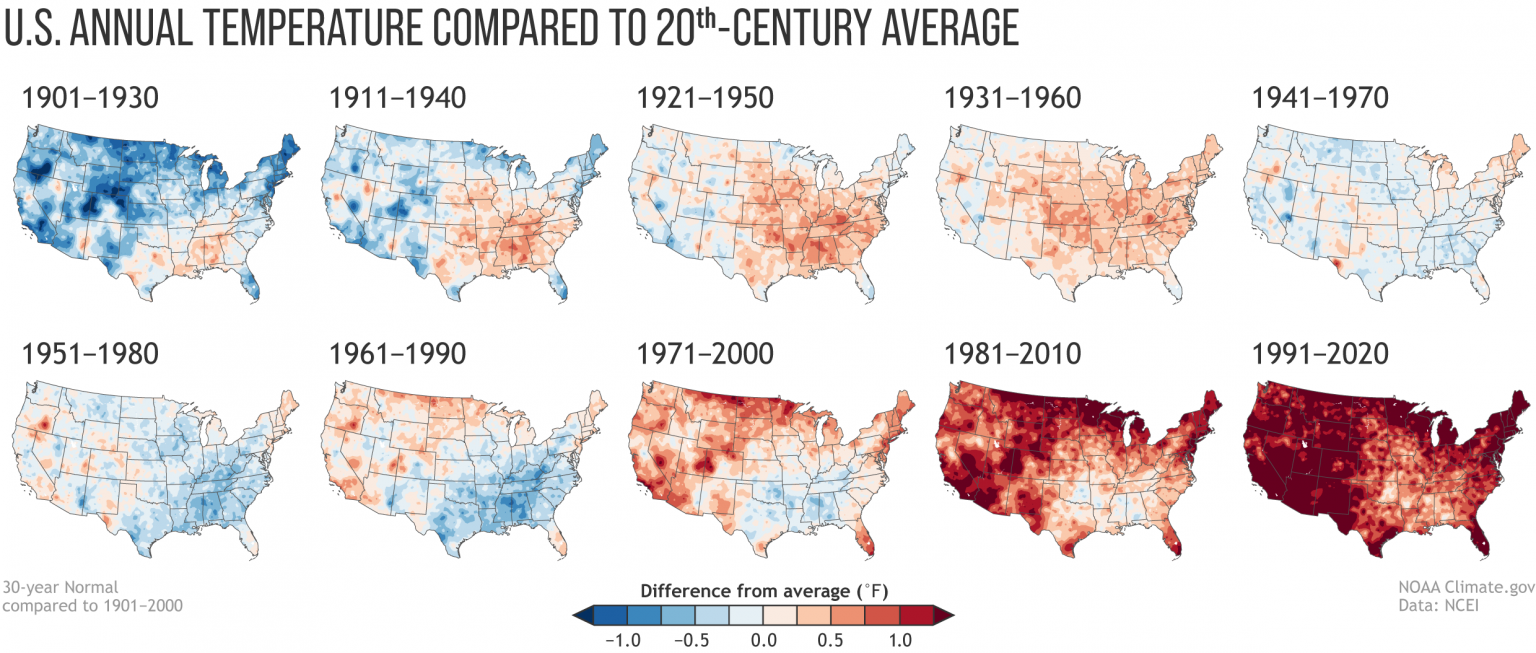
In May 2021, the National Oceanic and Atmospheric Administration (NOAA) released its decennial U.S. Climate Normals, which are 30-year averages. It showed that Houston’s environment is hotter and wetter than it was a decade ago. Average temperatures in the region increased between 0.6 to 1.0 degrees Fahrenheit and annual rainfall increased by about two inches compared to the previous 30-year averages. While the Climate Normals were not developed to track or document climate change, the difference between each installment does provide some evidence of climate change.
Houston is getting hotter for longer, putting our most vulnerable residents at risk
Greater Houston residents are well aware of how uncomfortable the summer heat can be. But extreme heat (defined by the Centers for Disease Control and Prevention, or CDC, as 95°F or hotter) can also cause illness and in some cases, death. Extreme heat kills more Americans than other weather-related disasters, and the World Health Organization states that temperature extremes can exacerbate chronic cardiovascular, respiratory and diabetes-related conditions. Seniors, young children and people with mental illness and chronic disease are at the highest risk of heat-related illnesses.
Continue reading about vulnerability to disasters and the Social Vulnerability Index
In the last decade the number of days with temperatures over 95°F rose significantly across the region. In the 2010s, Montgomery County had over 500 days with temperatures over 95° compared with fewer than 300 days in the previous decade. This is an increase of 231 days, equivalent to nearly two-thirds of a year, worth of extreme heat, in one decade. Fort Bend and Harris Counties also saw a 70% and 87% increase, respectively, in the number of days with extreme heat between the two decades.
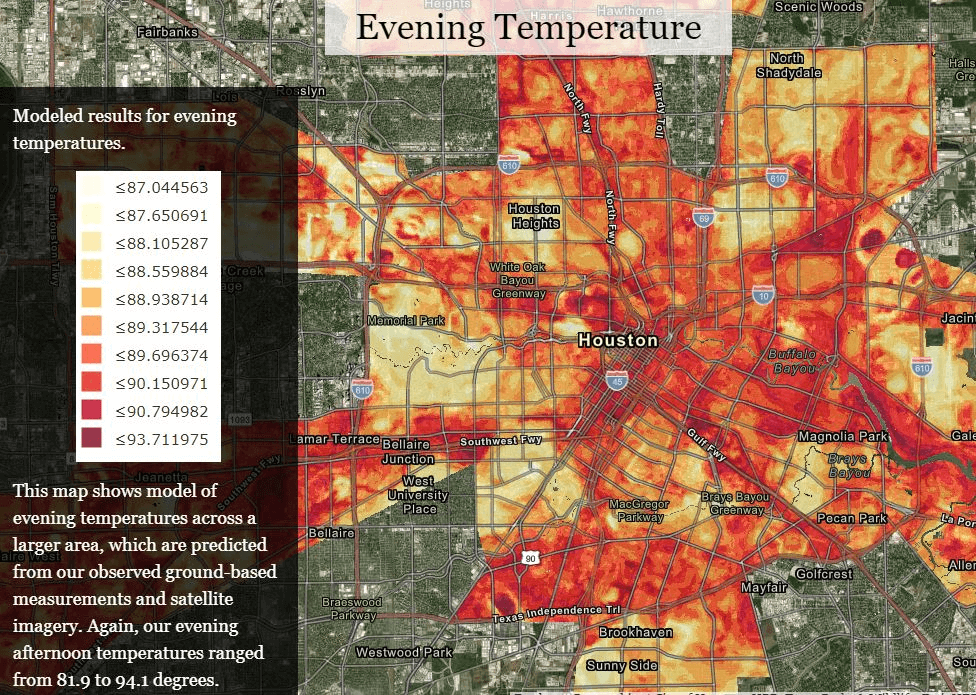
Heat islands worsen as overall temperatures rise
Temperatures are not consistent across counties. In fact, research shows that temperatures can vary by neighborhoods within the same city. These pockets of heat are known as “heat islands.” Heat islands occur in places with a preponderance of built infrastructure like parking lots, roads and buildings, which retain heat during the day and radiate that heat back into the surrounding air. They provide less shade and moisture than natural landscapes such as tree canopy and bodies of water and, consequently, contribute to higher temperatures. While heat islands can be found anywhere, they are typically a characteristic of urban areas, particularly during the summer months.
While heat islands are not caused by climate change or the increase in temperatures from greenhouse gases in the atmosphere, because climate change is increasing the intensity of heat and other weather events, heat islands are also being intensified, raising temperatures even higher.
The heat island effect results in daytime temperatures in urban areas about 1–7°F higher than temperatures in outlying areas and nighttime temperatures about 2–5°F higher, according to the 2017 Climate Science Special Report. In a 2021 report by Climate Central, Houston ranks fourth in the nation in highest urban heat island intensity, behind New Orleans, Newark, N.J., and New York City.
Houston neighborhoods that have the highest nighttime temperatures — the greatest driver of heat-related health issues — are most likely to occur in low-income areas and communities of color, according to maps created by Houston Harris Heat Action Team (H3AT).
Dramatic differences in temperature have dire health consequences. FEMA warns that extreme heat kills more Americans than other weather-related disasters, and the World Health Organization states that temperature extremes can exacerbate chronic cardiovascular, respiratory and diabetes-related conditions.
The number of extreme precipitation events in Houston has increased significantly
Since 1980, 12 rain events in our region have been declared disasters by FEMA and four have occurred since 2015. These 12 events are not associated with hurricanes or tropical storms and indicate our region’s increased vulnerability to intense rainstorms. Heavy precipitation is becoming more intense and more frequent across most of the United States.
Extreme precipitation is related to climate change in that, all else being equal, a warmer atmosphere can “hold” more water vapor, and therefore deliver more rainfall when conditions for heavy precipitation events occur. The more intense rainstorms are, the likelihood of flooding increases, along with the resulting economic and public health damages. And, as flooding increases, local municipalities will search for ways to mitigate damages by building reservoirs and retention ponds.
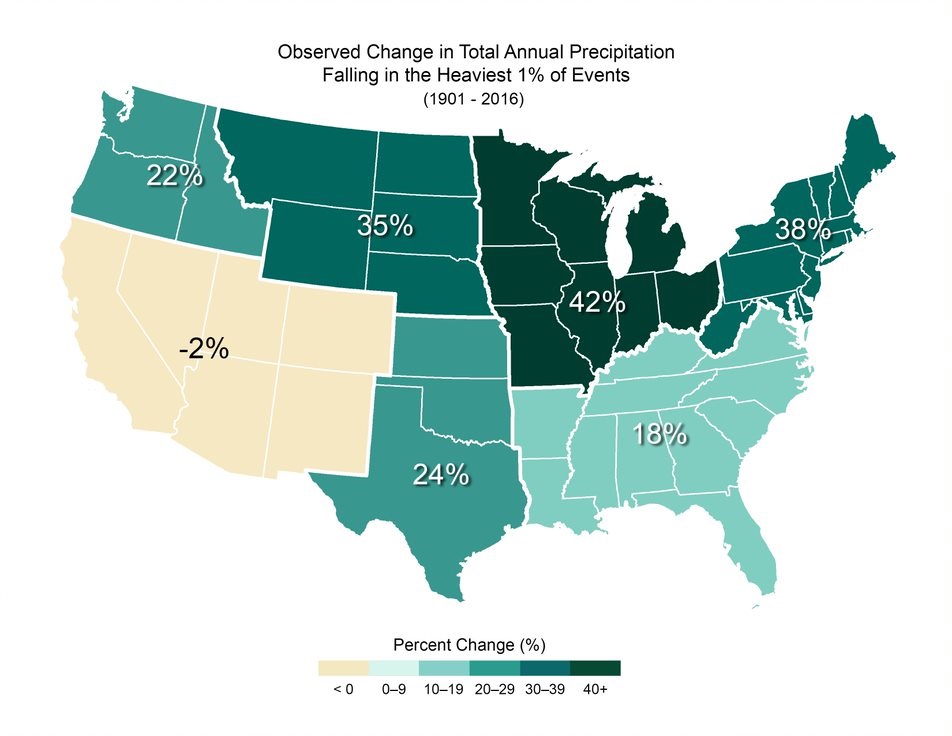
A comparison of rainfall across two time periods (1901–1960 versus 1986–2016), shows that for the majority of the country, more of the precipitation that falls each year is falling as part of a heavy precipitation event (defined as the top 1% of all days with precipitation during the reference period). In the region that includes Texas, Oklahoma, and Kansas, the precipitation that falls each year as part of a heavy precipitation event is 24% higher than it was in the first half of the 20th century.
Across the region the number of extreme precipitation days continues to increase. In Montgomery County, the number of days with 1 inch of rain increased from 84 in the 1980s to 120 in the 2010s, a 43% increase. Fort Bend and Harris counties also experienced similar increases, 37% and 25% respectively.
The increase in extreme precipitation is shown even more prominently when looking at days with 3 or more inches of rain. Each county saw three or fewer days with rain over 3 inches for the entire 1980s decade, but by the 2010s each county experienced between 12 and 17 days of this type of extreme precipitation.
Continue reading about flooding in Houston
Climate change can also increase the possibility and duration of droughts as evaporation increases, making periods with low precipitation drier than they would be in cooler temperatures. Although typically more common in the west, Texas saw a record breaking drought in 2011, whose effects were felt across the Houston region as well. The extreme dry weather led to wildfires that FEMA declared a disaster and destroyed 74 homes in Montgomery County. Across the region, millions of trees were lost with over half the trees in Memorial Park dying.
Continue reading about natural disasters in Houston
Climate change in Houston could mean a future where one-fifth of the year is above 95°F, rainstorms are more intense, and dry periods last longer
Why is Houston so hot right now? And why is it only getting hotter? The effects of the warming climate are likely to continue this pattern of extreme weather. To model the effects of climate change the U.N.’s Intergovernmental Panel on Climate Change uses four Representative Concentration Pathways (RPCs). RPCs are scenarios that describe the trajectories of carbon dioxide emissions.
The U.S. government developed Climate Explorer as part of its Climate Resilience Toolkit to show how different climate conditions are projected to affect the local areas across the nation in the coming decades. Locally, the Houston Advanced Research Center (HARC) created the Resilience Science Information Network (RESIN) Portal of the Upper Texas Gulf Coast to measure future climate conditions for nine counties in the Houston area. Both the U.S. Climate Explorer and RESIN use the moderate emission (RCP4.5) and higher emission (RCP8.5) scenarios to capture the range of possible climate futures.
The U.S. Climate Explorer shows that even under a moderate emissions scenario (RPC4.5), all three counties will experience over 50 days of extreme heat by 2030. In Montgomery County, the number of days with temperatures above 95°F is expected to increase to 72 days a year by 2030, or 20% of the year. For comparison, between 1969 and 1990, Montgomery County averaged 36.5 days of extreme heat. This forecast is nearly double this historic average.
Forecasts for days above 95° in 2030 are lower for Fort Bend and Harris counties at 54 and 57 days a year, respectively. The risk for each county continues to rise over the next 80 years. By 2090, all three counties could experience nearly 80 days of extreme heat a year.
In Houston, climate change has affected “Normal” temperatures but the precipitation forecasts are more nuanced. According to the Resilience Science Information Network (RESIN), “the average annual precipitation amounts are not projected to change significantly in total; however, the season in which the precipitation occurs will” (emphasis added). Climate scientists predict that our summers will be longer and characterized by lengthy heatwaves, more hot days and nights, and less rainfall as a result of climate change in Houston. By the 2090s Houston could see a 5-inch decline in annual rainfall mostly occurring in the summer. Essentially, when it does rain, it is expected to be more intense, but there is also the possibility of longer periods without rain.
While the annual amount of rain may not change significantly, the IPCC forecasts globally that the number of extreme precipitation days will worsen in the coming years as climate change releases more water vapor into the air.9 The forecast for Texas and Houston is no exception.10 Importantly for the Houston region, while the number of hurricanes in Houston is not projected to increase year-to-year, the warmer air and oceans temperatures will increase the strength of the hurricanes that do make landfall near us.11
Texas produces a larger share of its energy from renewables than the nation
In the U.S., 40% of energy consumed is used to generate electricity. Unlike traditional sources of electricity (like coal, petroleum, natural gas, and nuclear fuels), electricity produced from renewable resources (like wind, solar, biomass, and hydroelectric) generally does not contribute to climate change or local air pollution as they produce very little or no greenhouse gases.
Across the nation, renewable energy generation surpassed coal-fired generation for the first time in April 2019. In Texas, the share of power produced from renewable sources has outpaced the nation. In 2001, less than 2% of all fuel generation in the U.S. was generated by renewable energy, and even less was generated in Texas. By 2020, 12% of all fuels generated in the U.S. were from renewable energy while in Texas, 23% of all fuels generated came from renewable energy, nearly double the national rate.
Hydroelectric was the main source of renewable energy in the nation until 2019 when wind became more prevalent. Comparatively, almost all of the renewable energy generation in Texas over the past 20 years has come from wind, with solar increasing in recent years.
Despite its prominence across Texas, the production of wind energy in Greater Houston is not as feasible as solar. In recent years, homeowners have begun installing more solar panels. In the City of Houston, homeowner-installed solar capacity grew from 9.5 megawatts in 2017 to 42.5 at the end of 2019. The City of Houston is also committed to producing more solar energy and, in 2021, approved the conversion of a former landfill in the Sunnyside neighborhood into a solar farm.
In 2020, the City of Houston announced its Houston Climate Action Plan that aims to reduce greenhouse gases emissions, meet the Paris Agreement goal of carbon neutrality by 2050, and lead the global energy transition. The City of Houston’s commitment to renewable energy has earned it the #1 spot on the EPA’s Green Power Partnership list of Top 30 Local Governments.
Helpful Articles by Understanding Houston:
- Four Facts Every Resident Should Know About Houston’s Environment
- The State of Water Quality in Houston: Four Stats Every Resident Should Know
- Examining the Effects of Environmental Inequity in Houston
- Houston is Hot
- Examining Houston’s Reputation as a Car City
References:
- Kulp, S.A., Strauss, B.H. New elevation data triple estimates of global vulnerability to sea-level rise and coastal flooding. Nat Commun 10, 4844 (2019). https://doi.org/10.1038/s41467-019-12808-z
- Hauer, M. E. (2017). Migration induced by sea-level rise could reshape the US population landscape. Nature Climate Change, 7(5), 321-325.
- USGCRP, 2017: Climate Science Special Report: Fourth National Climate Assessment, Volume I [Wuebbles, D.J., D.W. Fahey, K.A. Hibbard, D.J. Dokken, B.C. Stewart, and T.K. Maycock (eds.)]. U.S. Global Change Research Program, Washington, DC, USA, 470 pp, doi: 10.7930/J0J964J6.
- Hsiang, S., Kopp, R., Jina, A., Rising, J., Delgado, M., Mohan, S., … & Houser, T. (2017). Estimating economic damage from climate change in the United States. Science, 356(6345), 1362-1369. Retrieved from https://projects.propublica.org/climate-migration/.
- IPCC, 2021: Summary for Policymakers. In: Climate Change 2021: The Physical Science Basis. Contribution of Working Group I to the Sixth Assessment Report of the Intergovernmental Panel on Climate Change [Masson-Delmotte, V., P. Zhai, A. Pirani, S. L. Connors, C. Péan, S. Berger, N. Caud, Y. Chen, L. Goldfarb, M. I. Gomis, M. Huang, K. Leitzell, E. Lonnoy, J.B.R. Matthews, T. K. Maycock, T. Waterfield, O. Yelekçi, R. Yu and B. Zhou (eds.)]. Cambridge University Press. In Press.
- EPA. 2021. Climate Change and Social Vulnerability in the United States: A Focus on Six Impacts. U.S. Environmental Protection Agency, EPA 430-R-21-003. Retrieved from https://www.epa.gov/cira/social-vulnerability-report/.
- IPCC, 2021: Summary for Policymakers. In: Climate Change 2021: The Physical Science Basis. Contribution of Working Group I to the Sixth Assessment Report of the Intergovernmental Panel on Climate Change [MassonDelmotte, V., P. Zhai, A. Pirani, S. L. Connors, C. Péan, S. Berger, N. Caud, Y. Chen, L. Goldfarb, M. I. Gomis, M. Huang, K. Leitzell, E. Lonnoy, J. B. R. Matthews, T. K. Maycock, T. Waterfield, O. Yelekçi, R. Yu and B. Zhou (eds.)]. Cambridge University Press. In Press.
- IPCC, 2014: Summary for policymakers. In: Climate Change 2014: Impacts, Adaptation, and Vulnerability. Part A: Global and Sectoral Aspects. Contribution of Working Group II to the Fifth Assessment Report of the Intergovernmental Panel on Climate Change [Field, C.B., V.R. Barros, D.J. Dokken, K.J. Mach, M.D. Mastrandrea, T.E. Bilir, M. Chatterjee, K.L. Ebi, Y.O. Estrada, R.C. Genova, B. Girma, E.S. Kissel, A.N. Levy, S. MacCracken, P.R. Mastrandrea, and L.L.White (eds.)]. Cambridge University Press, Cambridge, United Kingdom and New York, NY, USA, pp. 1-32.
- IPCC, 2021: Climate Change 2021: The Physical Science Basis. Contribution of Working Group I to the Sixth Assessment Report of the Intergovernmental Panel on Climate Change [Masson-Delmotte, V., P. Zhai, A. Pirani, S. L. Connors, C. Péan, S. Berger, N. Caud, Y. Chen, L. Goldfarb, M. I. Gomis, M. Huang, K. Leitzell, E. Lonnoy, J. B. R. Matthews, T. K. Maycock, T. Waterfield, O. Yelekçi, R. Yu and B. Zhou (eds.)]. Cambridge University Press. In Press. https://www.ipcc.ch/report/ar6/wg1/#SPM.
- Runkle, J., K. Kunkel, J. Nielsen-Gammon, R. Frankson, S. Champion, B. Stewart, L. Romolo, and W. Sweet, 2017: Texas State Climate Summary. NOAA Technical Report NESDIS 149-TX, 4 pp. https://statesummaries.ncics.org/chapter/tx/.
- Stoner, A. and Hayhoe, K. 2020. Climate Impact Assessment for the City of Houston. Retrieved from http://www.greenhoustontx.gov/reports/Climate-Impact-Assessment-2020-August.pdf.