Understanding Economic Opportunity in Houston
How opportunity and prosperity flow through our region
Healthy communities are built on a strong economic base. Access to fundamental elements of healthy communities are built on a strong economic base. Access to fundamental elements of financial stability such as jobs, credit, and small business resources is essential to ensuring that all Houstonians can contribute to the building of a vibrant Houston region for all. While Houston remains vital to the national economy, we’re still working toward greater and more equal access to opportunity at home. By taking steps to reduce income inequality in our region, we can make lasting improvements to our neighborhoods, education systems, and financial systems — improving economic security for all residents.
We have an economic and moral imperative to ensure everyone in the Houston region has equal access to economic opportunity and security — a fundamental condition of our collective success.
Vote for what matters to you
What issues do you think need attention, resources, and collaborative action?
0 votes
There are five subtopics for
economic opportunity in Houston
Poverty & Economic Mobility
Over 1,000,000
Houston-area households live below the Federal Poverty Level or experience ALICE. That’s about 44% of households in the region.
The acronym ALICE stands for Asset Limited, Income Constrained, and Employed. It represents families that are working and earn more than the poverty line but are unable to afford all their basic necessities.
In this page we talk about the following:
Poverty and Economic Mobility in Houston
Too many Houston-area families are stuck in the cycle of intergenerational poverty, preventing economic mobility
Despite a slight decline in poverty rates over the last decade, over one million households in Houston’s three-county region struggle to afford basic necessities.
Why poverty and economic mobility matter to Houston
Poverty has devastating consequences for individuals and families, entire communities, and our collective future. People who live in communities with high concentrations of poverty are at higher risk for cognitive1 2 and mental/ behavioral health challenges,3 chronic disease,4 higher mortality,5 and lower life expectancy.6 7 Children that grow up in poverty have higher prevalence of developmental delays,8 9 toxic stress,10 and chronic illness;11 they are also more likely to leave high school without a diploma,12 have fewer job prospects,13 or interact with the criminal system.14 Individuals who experience poverty as a child are more likely to experience poverty into adulthood, which contributes to intergenerational cycles of poverty.15 Intergenerational poverty not only prevents many from achieving their full potential, but also it holds back our collective society because we can’t benefit from the full talents and participation of our region’s most valuable asset — our people.
By working together to lift our neighbors out of poverty and into economic security, we can build a more vibrant Houston region with opportunity for all.
The data
Despite declining poverty rates since 2010, 54,000 more Houstonians live in poverty
The Official Poverty Measure was developed in the mid-1960s by Mollie Orshansky, an economist at the Social Security Administration, to measure the Lyndon B. Johnson Administration’s success in its “War on Poverty.” Her formula was derived from the cost of a minimum food diet for different family sizes, which she believed accounted for a third of a family’s overall budget. Orshansky concluded, if a family earned less than three times the cost of food, then they lived below the poverty threshold. Today’s measure is still based on this original calculation and is updated annually for inflation.
This measure, while consistent over decades, has limitations: It does not account for geographic cost-of-living differences — the threshold is the same regardless of where one lives in the continental United States; supplemental income such as tax credits, housing vouchers, or Medicare is not considered part of income; and the definition of a “family” is narrowly defined.16 According to the U.S. Census Bureau, “The official poverty measure is based on pretax cash income, while the Supplemental Poverty Measure (SPM) includes noncash benefits such as the Supplemental Nutrition Assistance Program (SNAP) and housing subsidies as well as net income after payroll taxes, tax credits and other necessary expenses.”
In 2023, the Federal Poverty Line, or poverty threshold, was $15,060 for an individual and $31,200 for a family of four. Based on this definition, 40.8 million Americans lived below the poverty level. Comprising 13% of the population, 1 out of 8 Americans live in poverty, according to the official measure.
In 2023, the poverty rate was 9% in Fort Bend, 16% in Harris, and 11% in Montgomery County. In Houston’s three-county region, the poverty rate is consistently lowest in Fort Bend County and highest in Harris County. Nearly 924,000 Houston-area residents lived below the poverty line in 2023.
Over the last decade, poverty rates in each Houston-area county steadily declined from 2010 to a decade-low in 2019, before ticking back up in 2021. Between 2010 and 2019, the share of people living below the poverty line fell by 2.8 percentage points in Fort Bend, 3.6 points in Harris, and 2.6 points in Montgomery counties. Between 2021 and 2023, poverty rates remained flat in Harris County, fluctuated in Montgomery County but ultimately ticked down by nearly one point, and increased 2.1 percentage points in Fort Bend County.
While the percentage of Houston-area residents who live in poverty is lower in 2023 than in 2010, the number of people living in poverty has increased during this period. As of 2023, the number of people living in poverty was 81,000 in Fort Bend County, 767,000 in Harris County, and 76,000 in Montgomery County.
Racial characteristics of poverty in Houston’s three county region
In the United States, poverty and race are strongly connected,17 with poverty rates generally highest among the Black population and lowest among the white population (among the four largest racial/ethnic groups). That this disparity exists in nearly every state and county in the nation, suggests that this lack of equality can be attributed more to the institutional disadvantages and discrimination that has been embedded into the various systems that guide American life — education, healthcare, housing, employment — than to individual characteristics.18
Exacerbating racial/ethnic disparities, Black families are 16 times more likely to have lived in poverty for at least three generations compared to white families, according to an analysis from Brookings Institution. One in five Black Americans (21.3%) are experiencing poverty for the third consecutive generation, compared to one in a hundred white Americans (1.2%).
A 2024 Opportunity Insights paper reveals that while significant racial disparities do still exist, the national Black-white mobility gap has shrunk by nearly 30% in the past 15 years. Comparing two birth cohorts, people born in 1978 and 1992, this study found that Black children born to low-income (25th percentile) parents in 1992 earned more as adults than those born in 1978. Meanwhile, white children from similar backgrounds saw a decline in earnings across cohorts. However, disparities remain. On average, the earnings gap between Black and white adults who grew up in low-income families is $13,000. We see a similar trend in median household income by race and ethnicity regionally and for the state and nation where racial disparities in income do still exist but these gaps have narrowed between 2010 and 2023.
Read more about race and economic mobility.
In 2023, 9.4% of white Americans nationwide lived in poverty, while the figures were 20.8% for the Black population, 16.7% for the Hispanic population, and 9.9% for Asian Americans. Poverty rates in Harris County and Texas closely mirror these national statistics.
In Fort Bend and Montgomery counties, the poverty rate is highest among the Hispanic population at 12.4% and 17.0% respectively. In Harris County, Black residents experience the highest poverty rate (21.2%), which is more than triple the rate for white residents (6.9%), followed closely by Hispanics (20.6%).
In Montgomery County, the proportion of the Hispanic population living below the poverty threshold fell by 8.7 percentage points between 2010 and 2023 — the greatest decline among racial/ethnic groups in the county—followed by a 5.3-percentage-point decline for the Black population in Montgomery County. In Harris County, Hispanic residents experienced the greatest declines in poverty rates (5.8 percentage points), followed by Asian Americans (5.5-percentage-point decline). In Fort Bend County, the poverty rate fell by 3.5 percentage points among Black residents and 3.1 for Hispanic residents compared to a 3.9-percentage-point increase for Asian American residents in Fort Bend County. Across all three counties between 2010 and 2023, the poverty rate for white residents was stagnant.
Single-parent families and poverty in Houston’s three-county region
Across the United States, the percent of families led by single parents declined from around 15% in 2010 to 13% in 2023. Locally, the share of families led by single parents in 2023 was 9% in Fort Bend County, 16% in Harris County, and 11% in Montgomery County. However, despite the declining rates, the number of single-parent led families in Houston’s three-county area has increased in the last decade because of the area’s growing population. The increase in this family structure is a concern because families led by single parents are five times more likely to live below the poverty threshold than two-parent-households. Among single-parent families in the United States, 70% are headed by women; and nearly 1 in 3 (32.2%) households led by single-moms lives in poverty compared to 1 in 18 (5.7%) households led by married couples.
In Harris County, 37% of single-mom families with children under 18 live in poverty — nearly 4 times the rate of married-couple families but a 5-percentage-point decreased compared to over a decade ago. In Montgomery County, the rate of single-mom families with children living in poverty is roughly five times that of married-couple families and has experienced a smaller decrease of 2 percentage points. We see the same gap in Fort Bend County between single-mom and married-couple families but the rate of single-mom families with children living in poverty has not improved over time although it is the lowest in the Houston three-county region.
Nearly one out of four children in Harris County lives in poverty
Research has shown that children growing up in poverty are more likely to face chronic stress and conditions that leave permanent changes in their brains, with implications for learning, health and behavior.19 Children who have lived many years in poverty are 90% more likely than their peers who never lived in poverty to enter their 20s without completing high school and, for girls, are four times more likely to become a teen mother setting the stage for the intergenerational transmission of disadvantage and onset of chronic poverty.20
Poverty rates for children are typically higher than for adults. The proportion of children under 18 living in poverty in 2023 was 10.4% in Fort Bend, 23% in Harris, and 15% in Montgomery County. Fort Bend and Montgomery counties have lower rates of children living in poverty compared to the state (18.4%) and the nation (16%) while Harris County has a higher rate.
Between 2010 and 2023, poverty rates for children under 18 have declined more than 5 percentage points across the nation, with the greatest declines occurring between 2010 and 2019. Between 2019 and 2021, poverty rates ticked back up in each county, the state, and nation — and in the case of Montgomery County, reversed all gains from the previous decade. As of 2023, the poverty rate in all three counties remains higher than it was in 2019.
Poverty rates for children 5 and under are even higher than they are for all children although this difference has decreased over the years. The proportion of children 5 and under living in poverty in 2023 was 10.5% in Fort Bend, 23.7% in Harris, and 15.1% in Montgomery County. Poverty trends for children 5 and under steadily declined between 2010 and 2019, but then ticked up during the pandemic, according to 2021 data. Between 2010 and 2023, poverty rates for children 5 and under decreased more across the state (-9.4 percentage points) and the nation (-8 points) compared to a decrease of 4.5 points in Fort Bend, 6.6 points in Harris, and 7.7 points in Montgomery counties.
In 2023, 10.0% of white children under 18 were experiencing poverty across the nation, compared to 29.3% of Black children, 21.6% of Hispanic children and 10.0% of Asian American children. The poverty rate for non-white children under 18, and children overall, in Harris County exceeds both national and state levels, while the rate of white children experiencing poverty in Harris County is lower.
Number of youths aged 16 to 19 neither working nor pursuing education decreases in Montgomery County and across the U.S.
Young people between the ages of 16 and 24 who are not enrolled in school or not working are classified as “opportunity youth.” Once a young person becomes disengaged from school or work, it becomes increasingly difficult to reconnect them to opportunities in education and skill development.21 Being disconnected is both a consequence and a cause of poverty, and opportunity youth are twice as likely to live in poverty as their connected peers and are less likely to be employed, own a home, or report good health when they reach their thirties.22
Approximately 8% of the 16-to-19-year-old population are neither working nor attending school in Texas, a higher share compared to the national average (6.9%). Fort Bend and Montgomery counties have the lowest rate of 16-to-19-year-olds considered opportunity youth at 5.8% and 5.1% respectively compared to 8.7% in Harris County. Between 2010 and 2022, the proportion of youth neither in school nor working decreased the most in Montgomery County by 3.1 percentage points. However, the number of opportunity youth increased in Fort Bend and Harris counties by 32% and 2% respectively while the number decreased by 9% in Montgomery County. This is compared to a 4% increased in the number of opportunity youth across the state and a 17% decrease across the nation.
One out of three Houston-area households experience ALICE
Because the Official Poverty Measure has such a low financial threshold, it is not a strong indicator to assess a population’s overall level of economic security. Although many believe that having a full-time job with a steady income allows someone to overcome poverty, the reality is that many full-time workers struggle to make ends meet. Indicators that take into consideration more realistic costs of living show that many working families are struggling.
The acronym ALICE stands for Asset Limited, Income Constrained, and Employed. It represents families that are working but unable to afford all their basic necessities like housing, food, childcare, health care and transportation. ALICE income thresholds include a more realistic cost of living than federal poverty guidelines.
To put things in perspective, the Texas cost-of-living in 2022 was $72,816 for a family of four and $26,268 for a single adult, which are both significantly higher than the Federal Poverty Level of $29,950 for a family of four and $14,880 for a single adult in 2022. ALICE income thresholds across all three counties indicate that a more realistic “survival budget” for a family of four is at least $78,012. With Harris County’s median household income below this threshold, it is no surprise we see higher portions of ALICE households in Harris County than in either Montgomery or Fort Bend counties.
Nearly one in three Houston-area households were classified as ALICE (Asset Limited, Income Constrained, Employed) in 2022, which is slightly higher than the state (29%) and national rate (29%). The proportion of households classified as ALICE was 27% in Fort Bend, 32% in Harris, and 27% in Montgomery counties. This is on top of the percentage of households that live below the Federal Poverty Line.
Over one million households (44%) in Houston’s three-county region either live below the poverty threshold or experience ALICE. While the number of households in poverty increased between 2010 and 2022 in the three-county region by 24%, the number of ALICE households increased at a much faster rate during the same period by 49% primarily as a result of rising costs and stagnant wages.
Economic mobility in the Houston area
Economic mobility, or intergenerational mobility, measures the percentage of children who grow up to earn more than their parents. To a great extent, it is a central component of the “American Dream.” It reflects the aspiration that through hard work and determination anyone can achieve their highest goals and fullest potential.
Per Opportunity Insights, a Harvard-based research nonprofit that conducts scientific research on how to improve upward mobility, more than 90% of children born nationally in the 1940s grew up to earn more than their parents. But over the past 50 years, this rate has been in decline, and is now only 50%, contributing to growing income inequality across the country. Research from Opportunity Insights shows upward economic mobility largely depends upon where one lives during childhood and the type of resources their family possesses. Children raised in low-income families have a much harder time securing higher incomes in adulthood.
The discrepancies illustrated by the Opportunity Atlas tool help to shed light on how different neighborhoods shape the development of human capital and support economic growth.23 A rigorous study found that the longer a child lived in a lower-poverty environment (defined as having a poverty rate below 10%) during childhood, the higher their chance to have better long-term outcomes.24 By moving families to a high mobility neighborhood that has a low poverty rate, more stable family structures, greater social capital, and better school quality, children from those families can make income gains in adulthood. The research suggests the need for a holistic approach to reduce racial disparities and improve upward mobility for all.
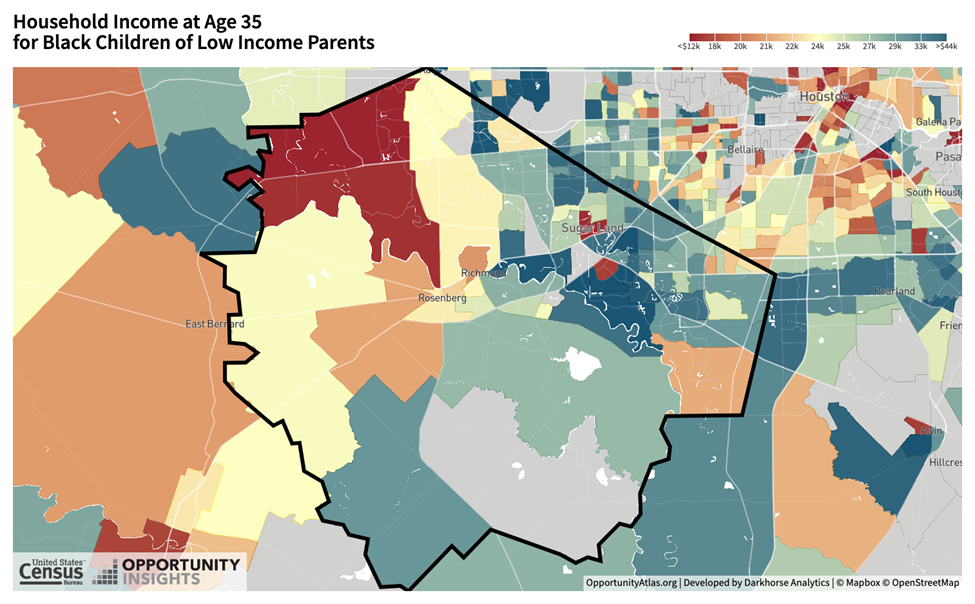
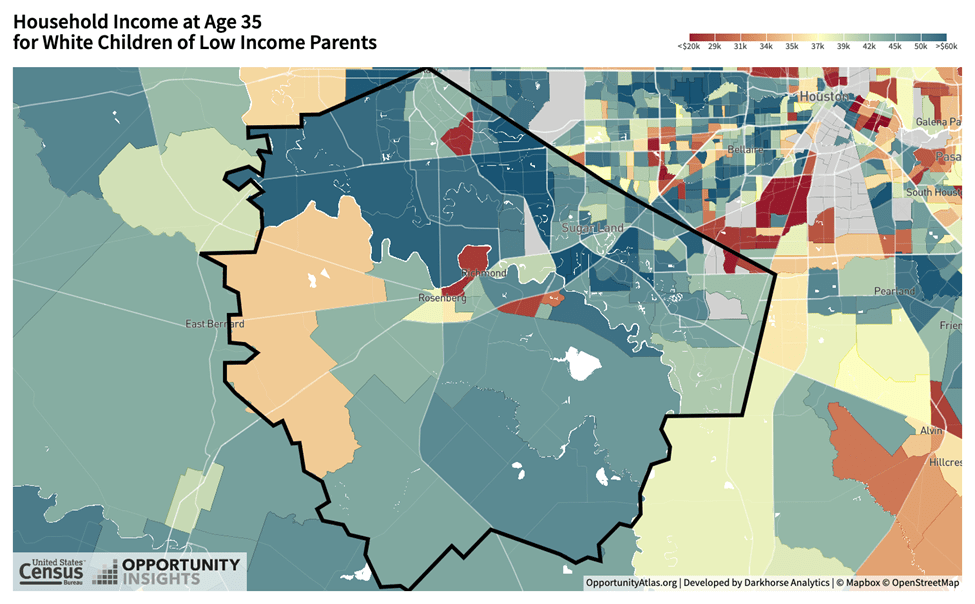
Economic mobility outcomes by income
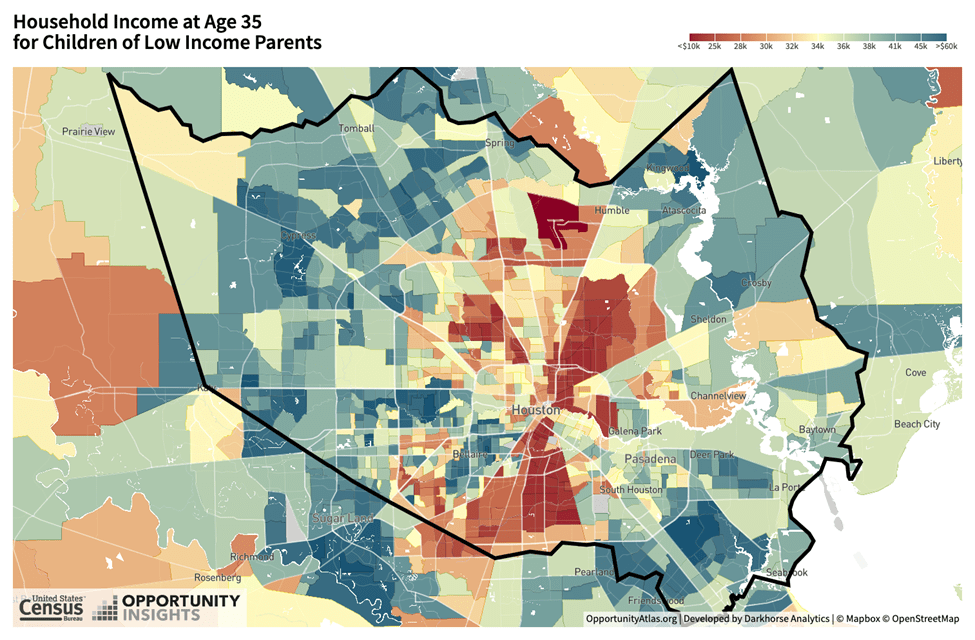
The maps below show economic mobility as the future incomes for children from low-income families, with red indicating lower future earnings while blue shows higher earnings. Across the country this map shows that economic mobility for children of low-income parents is lowest in the southeastern region of the U.S. and highest in the northern region.
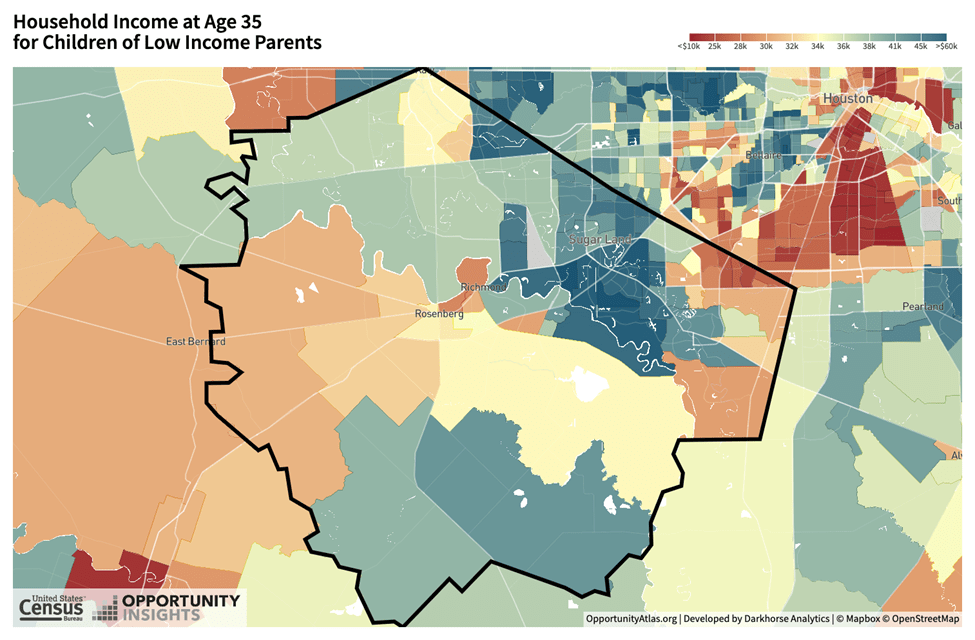
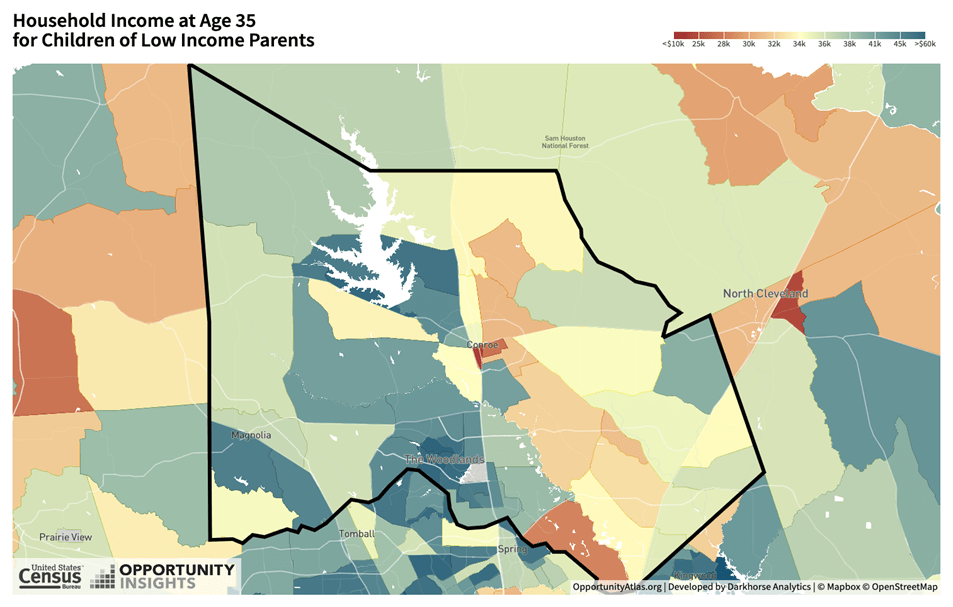
In Harris County, for example, the average child born between 1978 and 1983 from a low-income family (defined as families at the 25th percentile of household income) earns a household income of $33,000 at age 35. A low-income child of the same birth cohort in Fort Bend County earns $35,000 a year, and in Montgomery County earns $36,000 a year. In all three cases, the average child barely improves upon the income of the household in which they grew up.
Within each county, one’s childhood ZIP code can tell a great deal about expected outcomes. On average, a child from a low-income family raised in Bellaire, a high-income community in Southwest Harris County, surrounded by a peer group from a higher-income bracket has a much greater chance of earning a higher household income (over $40,000) than a low-income child raised in Fifth Ward ($23,000), a low-income community just north of downtown Houston. Similarly, a child from a low-income family who grew up in New Caney, between I-45 and I-59 in Northeast Harris County, earns a household income of $33,000 as an adult, compared to a low-income child from The Woodlands, a wealthy township in south Montgomery County, making around $50,000.
A child from a low-income family, defined as families in the 25th percentile of household income, raised in Greater Third Ward, a high-poverty area just south of downtown Houston, and a child raised in North Forest, a low-income community in Northeast Houston between 610 and beltway 8 loops, have equal chances of earning a household income of $20,000 in adulthood
Household income at age 35 for children of low-income parents by neighborhood/census tract where they grew up in Harris County.
Household income at age 35 for children of low-income parents by neighborhood/census tract where they grew up in Fort Bend County.
Household income at age 35 for children of low-income parents by neighborhood/census tract where they grew up in Montgomery County.
Economic mobility trends by income
This Mobility Outcomes map created by Opportunity Insights allows us to explore how economic mobility across the nation differs by place, race, gender, and class. In the summer of 2024, Opportunity Insights built upon this initial research and created the Mobility Trends map, which allows us to see how economic mobility is, or isn’t, improving over time and for whom.
On the left, the Mobility Outcomes map shows economic mobility as the future incomes for children from low-income families, with red indicating lower future earnings while blue shows higher earnings. Across the country this map shows that economic mobility for children of low-income parents is lowest in the southeastern region of the U.S. and highest in the northern region.
On the right, the Mobility Trends map, building on the Mobility Outcomes map, shows changes in economic mobility on the county-level by comparing income differences, over time, of adults born into similar places and circumstances. Like the Mobility Outcomes map, areas that show the greatest improvements in economic mobility are shaded in blue while places with deteriorating economic mobility are shaded in red.
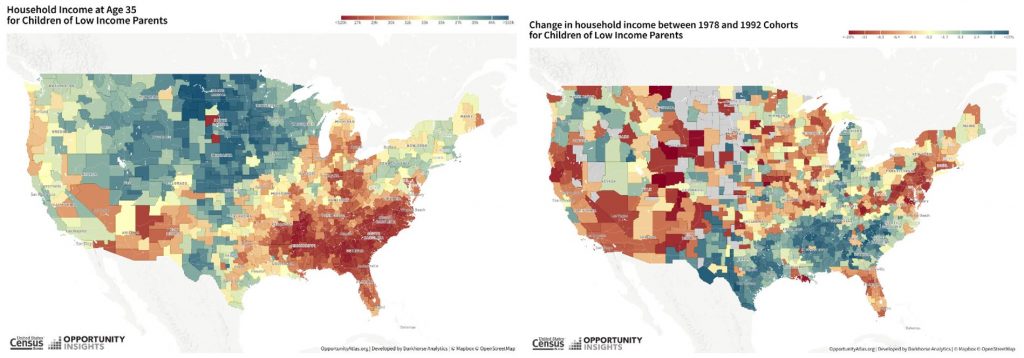
Are the future incomes of children born into low-income families in 1992 higher than the future incomes of similar children born in 1978? It depends. Nationally, the future income of children from low-income (25th percentile) families born in 1992 is 4.2% lower than similar children born in 1978. This is compared to it being stagnant for children born to high-income (75th percentile) parents suggesting increasing class gaps at the national level.
In our three-county region, the change in economic mobility (the difference in adult earnings between those born in 1992 and those born in 1978) stagnated for children born to low-income and children born to high-income parents.
However, comparing changes in economic mobility for children born to the lowest-income (1st percentile) and highest-income (100th percentile) parents tells a much different story.
Economic mobility for children born to the lowest-income parents has increased by 2% in Montgomery County while it has not changed in Fort Bend and Harris counties. For children born to the highest-income parents, there was an increase of 6.1% in Fort Bend County, 6.7% in Harris County, and 4% in Montgomery County, pointing to an increasing income gap across our region between children born to the lowest- and highest-income households.
Economic mobility outcomes by race
Economic mobility can affect subgroups in the same neighborhood in different ways, shedding light on some racial and class-based disparities. For example, the average Black child from a low-income family in Fort Bend County earns a household income of $27,000 in adulthood, compared to $44,000 for the average white child from a low-income family. Similarly, a Black child from a low-income family raised in Montgomery County earns a household income of $25,000, compared to a white child from a low-income family making $39,000.
This dataset has also shown downward mobility varies by race. Black boys who grow up in America, even from an affluent family and live in a high-income neighborhood, still earn less in adulthood than white boys with similar backgrounds.25 Moreover, white boys from affluent families are more likely to stay wealthy in adulthood while Black boys from similar families are more likely to become poor rather than retain their socioeconomic status as adults.
Economic mobility trends by race
The newest addition to Opportunity Atlas—the Mobility Trends map—shows that while racial disparities in economic mobility still exist, they have shrunk over time while gaps by income level have widened. This study reveals that the national income gap between white children from low-income (25th percentile) and high-income (75th percentile) households has widened by 30%, while the earnings gap between white and Black children from low-income households has shrunk by the same amount.
However, white children from low-income families still earn, on average, $13,000 more in adulthood than Black children in similar situations. Additionally, the Black-white economic mobility gap narrowed mainly due to improvements in Black children’s chances of moving out of poverty, not their likelihood of reaching the upper class. Black children born into the lowest income quintile in 1978 were 15 times more likely to remain there compared to white children—this gap decreased by 4.1 percentage points for those born in 1992. However, the likelihood of a Black or white child born into a low-income family reaching the top income quintile has not changed.
Our three-county region mirrors national trends with the income gap between white children born to low-income and high-income parents widening by 36% in Fort Bend County, 30% in Harris County, and 18% in Montgomery County. Similarly, the income gap between white and black children from low-income families has decreased by 42% in Fort Bend County, 35% in Harris County, and 31% in Montgomery County. However, disparities persist with a future earnings gap of $7,500 between white and Black children born into low-income families in 1992 in Fort Bend County and a gap of $8,200 in Harris and Montgomery counties.
Helpful Articles from Understanding Houston
References:
- Mullainathan, S., & Shafir, E. (2013). Scarcity: Why having too little means so much. Macmillan.
- Shiv, B., & Fedorikhin, A. (1999). Heart and mind in conflict: The interplay of affect and cognition in consumer decision making. Journal of consumer Research, 26(3), 278-292.
- Belle, D., & Doucet, J. (2003). Poverty, inequality, and discrimination as sources of depression among U.S. women. Psychology of Women Quarterly, 27(2), 101-113. https://doi.org/10.1111/1471-6402.00090
- Shaw KM, Theis KA, Self-Brown S, Roblin DW, Barker L. Chronic Disease Disparities by County Economic Status and Metropolitan Classification, Behavioral Risk Factor Surveillance System, 2013. Prev Chronic Dis 2016;13:160088. DOI: http://dx.doi.org/10.5888/pcd13.160088
- Mode, N. A., Evans, M. K., & Zonderman, A. B. (2016). Race, neighborhood economic status, income inequality and mortality. PLoS ONE, 11(5), e0154535. https://doi.org/10.1371/journal.pone.0154535
- Singh, G. K., & Siahpush, M. (2006). Widening socioeconomic inequalities in US life expectancy, 1980–2000. International Journal of Epidemiology, 35(4), 969–979. https://doi.org/10.1093/ije/dyl083
- Braveman, P. A., Cubbin, C., Egerter, S., Williams, D. R., & Pamuk, E. (2010). Socioeconomic disparities in health in the United States: What the patterns tell us. American Journal of Public Health, 100(Suppl 1), S186–S196. https://doi.org/10.2105/AJPH.2009.166082
- Eamon, M. K. (2001). The effects of poverty on children’s socioemotional development: An ecological systems analysis. Social Work, 46(3), 256–266.
- Justice, L. M., Jiang, H., Purtell, K. M., Schmeer, K., Boone, K., Bates, R., & Salsberry, P. J. (2019). Conditions of poverty, parent-child interactions, and toddlers’ early language skills in low-income families. Maternal and Child Health Journal, 23(7), 971–978. https://doi.org/10.1007/s10995-018-02726-9
- Evans, G. W., & Kim, P. (2013). Childhood poverty, chronic stress, self-regulation, and coping. Child Development Perspectives, 7(1), 43–48. https://doi.org/10.1111/cdep.12013
- Council on Community Pediatrics, Gitterman, B. A., Flanagan, P. J., Cotton, W. H., Dilley, K. J., Duffee, J. H., Green, A. E., Keane, V. A., Krugman, S. D., Linton, J. M., McKelvey, C. D., & Nelson, J. L. (2016). Poverty and child health in the United States. Pediatrics, 137(4), e20160339. https://doi.org/10.1542/peds.2016-0339
- Baydu, M. M., Kaplan, O., & Bayar, A. (2013). Facing the influence of poverty on graduation rates in public high schools. Procedia-Social and Behavioral Sciences, 84, 233-237.
- National Academies of Sciences, Engineering, and Medicine; Division of Behavioral and Social Sciences and Education; Committee on National Statistics; Board on Children, Youth, and Families; Committee on Building an Agenda to Reduce the Number of Children in Poverty by Half in 10 Years; Le Menestrel S, Duncan G, editors. A Roadmap to Reducing Child Poverty. Washington (DC): National Academies Press (US); 2019 Feb 28. 3, Consequences of Child Poverty. Available from: https://www.ncbi.nlm.nih.gov/books/NBK547371/
- Jarjoura, G. R., Triplett, R. A., & Brinker, G. P. (2002). Growing Up Poor: Examining the Link between Persistent Childhood Poverty and Delinquency. Journal of Quantitative Criminology, 18(2), 159–187. http://www.jstor.org/stable/23366800
- Wagmiller Jr, R. L., & Adelman, R. M. (2009). Childhood and intergenerational poverty: The long-term consequences of growing up poor. National Center for Children in Poverty. https://www.nccp.org/publication/childhood-and-intergenerational-poverty/
- Desmond, M. (2023). Poverty, by America. Penguin Books.
- Lin, A. C., & Harris, D. R. (2009). The colors of poverty: Why racial & ethnic disparities persist. Ann Arbor, 1001(48109), 43091. Retrieved from https://npc.umich.edu/publications/policy_briefs/brief16/PolicyBrief16.pdf
- Williams, D. R., Mohammed, S. A., Leavell, J., & Collins, C. (2010). Race, socioeconomic status, and health: Complexities, ongoing challenges, and research opportunities. Annals of the New York Academy of Sciences, 1186(1), 69–101. https://doi.org/10.1111/j.1749-6632.2009.05339.x
- Ratcliffe, Caroline E., and Signe-Mary McKernan. “Child poverty and its lasting consequence.” Urban Institute Low-Income Working Families Working Paper 21 (2012).
- Ratcliffe, Caroline E., and Signe-Mary McKernan. “Child poverty and its lasting consequence.” Urban Institute Low-Income Working Families Working Paper 21 (2012).
- Durand, Casey P., Adriana Garcia, Ryan Holeywell, Kimberly Johnson-Baker, Heather O’Connell, Ethan Raker, and Jie Wu. “Houston’s Opportunity: Reconnecting Disengaged Youth and Young Adults to Strengthen Houston’s Economy.” Rice Kinder Institute for Urban Research (2016).
- Mendelson, T., Mmari, K., Blum, R. W., Catalano, R. F., & Brindis, C. D. (2018). Opportunity Youth: Insights and Opportunities for a Public Health Approach to Reengage Disconnected Teenagers and Young Adults. Public health reports (Washington, D.C. : 1974), 133(1_suppl), 54S–64S. https://doi.org/10.1177/0033354918799344
- Badger, Emily, et al., “Extensive Data shows Punishing Reach of Racism for Black Boys,” The New York Times, March 19, 2018.
- Chetty, Raj, et al. “The Opportunity Atlas: Mapping the Childhood Roots of Social Mobility.” National Bureau of Economic Research, no. w25147 (2018).
- Chetty, Raj, Nathaniel Hendren, and Lawrence F. Katz. “The Effects of Exposure to Better Neighborhoods on Children: New Evidence from the Moving to Opportunity Experiment.” American Economic Review 106, no. 4 (2016): 855-902.
- Badger, Emily, et al., “Extensive Data shows Punishing Reach of Racism for Black Boys,” The New York Times, March 19, 2018.
Income & Inequality
3%
Between 2010 and 2021, median household income in Harris County increased only 3%.
The Black-white income gap in Harris County has not improved much: In 2023, white households earned 96% more than Black households compared to 2010 when the gap was 101%.
In this page we talk about the following:
Income and Inequality in Houston
While the overall Houston region is rich in economic prosperity, persistent income inequalities signal many residents of color have not benefited
Incomes in the Houston region have barely increased over the last decade, yet disparities across race/ethnicity have persisted.
Why income and inequality matter to Houston
Strong and stable incomes help our communities thrive. Although income in itself does not necessarily equate to greater well-being, higher levels of household income generally allow for additional (or more desirable) choices, opportunities, and resources, including the choice of where to live, opportunities for employment, and access to parks, safe neighborhoods, and fresh food. Without sufficient wages, people struggle to afford basic necessities and invest less in their education, business, or future. In fact, income and wealth shape some of the most important factors of everyday life, including overall health, homeownership, job type and more.1 Despite Houston’s diverse and dynamic nature, severe income inequalities exist across gender and race/ethnicity, which negatively affect all of us. McKinsey & Company estimates that national GDP could be 4 to 6 percent higher by 2028 if we close the racial wealth gap.
By delving into the facts and striving to understand our communities better, Houstonians can take steps to ensure that all families across the three-county area can participate in and reap the benefits of our region’s expanding prosperity.
The data
Household incomes in the Houston area remain sluggish yet disparities persist
Household income measures a family’s ability to meet their basic needs, and includes earnings for each household member, income from social security, interest, dividends, and other sources. Median household income is the the level at which half of households earn more and half of households earn less.
In 2023, the median household income (in 2023 dollars) was $105,441 in Fort Bend County (the highest in Houston’s three-county region), $91,841 in Montgomery County, and $72,336 in Harris County. While median household income in Fort Bend and Montgomery counties is higher than in Texas and the U.S. overall, Harris County’s is about the same.
Between 2010 and 2023, income growth in the Houston region significantly lagged behind that in the state and nation overall. Median household income remained relatively flat in Fort Bend and Montgomery counties but slightly grew by 3% in Harris County. This is a slower growth rate compared to the state (12% increase) and nation (11% increase) during the same period.
Consistent with patterns seen in communities across the country, median household income in the Houston area varies significantly by racial/ethnic group. Racial discrimination in many forms, including in education, hiring, pay practices, and homeownership contributes to persistent earnings gaps.2 3
As of 2023, the racial/ethnic wage gap continues to persist throughout the Houston region, consistent with trends at the state and national level. In 2023, white households in Fort Bend County earned 32% more than Black households and 46% more than Hispanic households — this is an improvement from 2010 when white households earned 63% and 85% more than Black and Hispanic households, respectively.
The Black-white income gap in Harris County has not improved much in the last decade. In 2023, white households in Harris County earned 96% more than Black households compared to 2010 when the gap was 101%. In 2023, white households in Harris County earned 60% more than Hispanic households, which is an improvement from 2010 when white households earned 83% more.
Income disparities in Montgomery County appear to have shrunk in the last decade.4 In 2023, white households in Montgomery County earned 29% more than Black households and 36% more than Hispanic households. This is a significant improvement from 2010 when white households earned 84% and 65% more than Black and Hispanic households, respectively.
Wealth disparities still persist and have worsened since 1963
Wealth includes all of a person’s or family’s assets including a home, savings, stocks, property and income. These assets can help families endure economic shocks like layoffs, natural disasters, or health emergencies.5 Homeownership stands as the primary means of accumulating wealth, but disparities persist in homeownership rates along racial and ethnic lines. Further, some populations tend to receive a lower return-on-investment in college and in incomes compared to the white population, meaning Black and Hispanic families are less able to turn each dollar of income or amount of education into wealth as white families.6
Data between 1963 and 2019 from the Survey of Consumer Finances shows how the distribution of wealth in the United States has become more unequal:
- Families in the bottom 1% are roughly $100,000 in debt (negative wealth), being 15x more in debt than in 1963.
- Families in the bottom 10% are roughly $500 in debt (negative wealth).
- Families at the 90th percentile have seen their wealth grow 5.4 times from 1963 ($238,860) to 2019 ($1,291,982).
- Families in the top 1% of earners have seen their wealth multiplied by 8 times from 1963 ($1,457,201) to 2019 ($11,762,462).
Wealth cannot be calculated for the Houston area due to data limitations. As a result, the subsequent analysis focuses on income and earnings and how they are unequally distributed among people in the Houston area.
In 2023, similar to the state and national levels, the top 20% of households in Harris County received 53.2% of the income, while the bottom 20% of households received only 2.9%. Similar patterns can be found in Fort Bend and Montgomery counties, where the top 20% of households received 47.8% and 49.6% of total income, respectively, while the bottom 20% of households received 3.6% and 3.7% of the income, respectively.
Gender and racial/ethnic pay gaps barely budge
Despite growing median income and employment, pay inequalities by race and gender in Houston’s three-county region continue. It’s important to note that this data does not look specifically at men and women with the same jobs or qualifications, however research has shown that gender pay disparities persist within occupations — with men making more, on average, than women,7 and even as women enter male-dominated fields, the overall pay actually begins to fall. Research also shows that women are less likely to hold or grow into higher-level, high-paying jobs compared to men, which affects this gender gap.8
One way to measure this disparity is to use the female-to-male earnings ratio, which represents the earnings of women compared to the earnings of men measured by cents on the dollar. The higher the earnings ratio, the smaller the pay gap.
In 2023, across the nation and state, women earned 82 cents for every dollar men were paid. In 2023, for every $1 earned by men, women earned 79 cents in Fort Bend County, 84 cents in Harris County, and 77 cents in Montgomery County.
From 2010 to 2023, the gender pay gap improved the most in Fort Bend County going from 0.70 in 2010 to 0.79 in 2023. This gap remained unchanged in Harris County between 2010 and 2023 and worsened by two cents in Montgomery County.
Earnings ratio by race ethnicity
The racial and ethnic earnings ratio measures median earnings for people who identify as Black, Indigenous, Latino, or Asian American relative to the earnings of white residents. In the U.S., gaps between white workers and Black and Hispanic workers have persisted since 1970.
In each Houston-area county, Asian American, Black, and Hispanic workers earn less relative to their white counterparts, except Asian-American workers in Fort Bend County who earn more. Between 2010 and 2023, this gap has decreased for each of the racial groups across all three counties.
Gender earnings ratio by race/ethnicity
Belonging to a certain race or age group does not protect women from experiencing gender pay disparities. This disadvantage affects women at every education, occupation, and age group, though higher-earning women and mid-career women are at a greater disadvantage compared to their male counterparts. And relative to white male wages, Black and Hispanic women are the most disadvantaged.9
In Fort Bend and Harris counties, white women experience the greatest gender pay gap, earning the least relative to each dollar a white man makes; whereas Black women consistently have the lowest gender pay gap compared to their male counterparts. This is most likely because the average white man earns so much, while the pay for the average Black man is significantly lower, by comparison. In Montgomery County, Asian women experience the greatest gender pay gap.
Unlike the racial/ethnic pay gap, the gender pay gap by race and ethnicity has not improved across the board. Across the four largest racial groups in all three counties, the state, and the nation, the gender pay gap has improved the most for Asian American women, compared to Asian American men, in Harris County decreasing by 11 cents while it has widened the most for Asian-American women in Montgomery County widening by 31 cents.
Helpful Articles by Understanding Houston:
- A Closer Look at Financial Hardship in the Houston Region
- The Great She-cession: How COVID-19 is impacting women in the workforce
- Is Houston really that affordable?
References:
- Killewald, Alexandra, Fabian T. Pfeffer, and Jared N. Schachner. “Wealth Inequality and Accumulation“. Annual Review of Sociology 43 (2017): 379-404.
- Wilson, V., & Darity Jr, W. (2022). Understanding black-white disparities in labor market outcomes requires models that account for persistent discrimination and unequal bargaining power.
- Pager, D., & Shepherd, H. (2008). The Sociology of Discrimination: Racial Discrimination in Employment, Housing, Credit, and Consumer Markets. Annual review of sociology, 34, 181–209. https://doi.org/10.1146/annurev.soc.33.040406.131740
- At a glance, Montgomery County’s graph on the median household incomes by race/ethnicity is extremely varied – but this may be due to issues with sample sizes and the quality of the data over time, and not an actual reflection of the wage gap either worsening or getting better in the county.
- Hanks, Angela, Danyelle Solomon, and Christian E. Weller. “Systematic inequality: How America’s structural racism helped create the black-white wealth gap.” Washington: Center for American Progress, February 21, 2018
- Sullivan, Laura, Tatjana Meschede, Lars Dietrich, and Thomas Shapiro. “The Racial Wealth Gap.” Institute for Assets and Social Policy, Brandeis University. DEMOS (2015).
- Gould, E., Schieder, J., & Geier, K. (2016). What is the gender pay gap and is it real?: The complete guide to how women are paid less than men and why it can’t be explained away. Retrieved from https://www.epi.org/publication/what-is-the-gender-pay-gap-and-is-it-real/
- Graf, Nikki, Anna Brown and Eileen Patten. “The narrowing, but persistent, gender gap in pay.” Pew Research Center (blog). March 22, 2019.
- Gould, E., Schieder, J., & Geier, K. (2016). What is the gender pay gap and is it real?: The complete guide to how women are paid less than men and why it can’t be explained away. Retrieved from https://www.epi.org/publication/what-is-the-gender-pay-gap-and-is-it-real/
Unemployment & Jobs
1 out of 6
Houston-area workers have jobs that earn $15,000 or less annually.
Job growth between 2010 and 2023 in the Houston region outpaced the nation, and the proportion of workers who had “low-wage” jobs fell to 1 out of 6.
In this page we talk about the following:
Unemployment and Jobs in Houston
Strong job and industry growth are essential to increasing economic opportunity and security for all Houstonians
Houston’s three-county region continues to have strong jobs and industry growth over the last decade.
Why employment matters to Houston
A growing, skilled workforce and strong job growth are critical to continuous economic growth. In theory, when jobs are created in a region, skilled workers move in, our population expands, wages rise, more people spend more money, employment grows, unemployment falls, and a variety of positive social impacts follow.1 However, the reality is that not all Houstonians benefit equally from a strong economic cycle. The vitality of the region’s economy — and the livelihood of its residents — depends on our ability to operate an effective and inclusive economy that appropriately educates and trains our future and current workforce and produces jobs that provide a good standard of living.
When we invest in and meaningfully support all adults to fully participate in our region’s economic prosperity, we will see significant — and inclusive — economic growth.
The data
Houston-area unemployment rates hold steady from 2022 to 2023
The unemployment rate measures the share of workers in the labor force who do not currently have a job but are actively looking for work. The level of unemployment is a general measure of how the overall economy is operating, and changes in the rate can be an important signal of changes in the labor market and economy.
During the Great Recession in 2010, unemployment rates in Fort Bend and Montgomery counties were at a 30-year high but steadily declined to a two-decade low in 2019. Of course, unemployment rates spiked in 2020 — the result of pandemic-related job losses. However, between 2020 and 2022, unemployment rates declined significantly returning to pre-pandemic levels and have remained flat since then. In 2023, the unemployment rate in Harris County (4.3%) was highest in Houston’s three-county region, while the unemployment rate was 4.0% in Fort Bend and 3.9 in Montgomery counties.
Job growth in Houston’s three-county region is positive but slower from 2022
Job growth is a key indicator of economic expansion and a strong job market. As a leading economic indicator, robust job growth typically signals a healthy economy.
The COVID-19 pandemic severely affected job availability with all three counties, the state, and the nation experiencing the greatest decline in jobs in 2020 than in at least the last decade. Recovery began in 2021, and by 2022, job growth reached its highest levels in years. However, between 2022 and 2023, job growth stagnated or declined with Fort Bend County experiencing the sharpest decline in job growth decreasing by eight percentage points.
Even so, Fort Bend and Montgomery counties continued to experience strong job growth between 2022 and 2023 at about 5% outpacing job growth across Texas (3%) and the U.S. (2%). Looking at trends over a longer period of time between 2010 and 2023, job growth in Fort Bend (88%), Montgomery County (77%), and Harris County (21%) outpaced the nation overall (19%).
Industries in Houston see steady, consistent growth
Texas and Houston’s three-county area continue to be a place of business opportunity and growth. According to the Greater Houston Partnership, which provides economic data and analysis for the nine-county Houston-The Woodlands-Sugar Land Metropolitan Statistical Area (Houston MSA), found that the region ranks third in the number of Fortune 500 headquarters, and Texas has ranked the best state for business for 19 years in 2023.
Between 2010 and 2023, Houston’s three-county region saw the greatest growth in businesses in the following industries: education and health services,leisure and hospitality, and professional and business services. Growth in Houston-area businesses has occurred in each of the three counties, with Fort Bend and Montgomery counties experiencing the fastest businesses growth — mirroring their rapid population growth. While it may appear that Harris County business growth has slowed, the lower growth rates are more a reflection of a large, existing set of businesses already in Harris County, and so while growth continues for the county, its relative growth is smaller compared to its rapidly growing neighbors.
Fort Bend County has doubled the number of business establishments between 2010 and 2023, with the greatest growth in professional and business services (136% increase), followed closely by information (132% increase) and education and health services (130% increase), and then leisure and hospitality (113% increase).
In Harris County, the number of establishments increased by 25% from 2010 to 2023 — a slower growth rate given the volume in the third most populous county in the nation. Among the largest three industries, establishments in education and health services grew the most (61% increase), followed by leisure and hospitality (44%), and professional and business services (34%).
The number of establishments in Montgomery County grew by 75% between 2010 and 2023. Among the largest three industries, establishments in education and health services grew the most (115%), followed by information (104%), and professional and business services (94%).
The top Houston-area job is in office and administrative support
The type of work people do, or occupational mix, is important to understanding the economy of a region. Changes in occupation often reflect business innovations. When a business adopts new technology, produces new products, or makes other changes to its processes, doing so usually causes changes in occupational mix. For example, if a factory automates, the number of production workers usually declines, while the number of engineers increases.2
There have been five major shifts in the occupational mix in U.S. history: the decline of agricultural employment (1870 to 1970), the rise of office work (1870 to 1970), the decline of manual labor (1940 to 1970), the decline of production work (1950 to 2010), and the rise of management (1970 to 2005).3
The top Houston-area job in each county is in office and administrative support, and while the counties share commonalities in occupational mix, there are notable differences. In Fort Bend County, most people are employed as office and administrative support (12%), educational instruction (10%), food prep and serving (10%), sales (10%) and transportation/warehouse (10%). In Harris County, most residents are employed as office and administrative support (12%) and transportation/warehouse (10%), reflecting the significance of trade in Houston — which is a major distribution center for the nation and globe, as the port of Houston is the top foreign trading port in the U.S. by weight. In Montgomery County, most workers are employed as office and administrative support (13%), food prep and serving (11%), and sales (10%).
More than half of Houston-area jobs pay more than $40,000 annually
Availability of jobs is crucial, but it is equally important that those jobs offer fair and livable wages. The Census categorizes jobs as low-wage (i.e., jobs that pay $15,000 or less annually), medium-wage, and high-wage, with “high-wage” jobs being any work that earns more than $40,000 annually. An individual earning more than $40,000 annually is living above the Federal Poverty Line, however, they are not earning enough to make ends meet given the line’s rudimentary determination.
Based on the Census definition, 58% of jobs in the three-county area are classified as “high-wage” positions, in that they pay more than $40,000 annually. When comparing across the three-counties, Harris County has the largest percentage of residents working in a high-wage job (59%) compared to Fort Bend County (47%) and Montgomery County (53%). Between 2005 and 2022, the number of “high-wage” jobs increased 211% in Fort Bend, 106% in Harris, and 328% in Montgomery counties and 119% in Texas overall.
About 16% of the three-county area residents are in low-wage jobs ($15,000 or less annually). About 21% of workers in Fort Bend County, 18% in Montgomery County, and 15% in Harris County are in low-wage jobs. This means that 1 in 6 workers in the region work at least 40 hours a week, yet bring home less than $1,250 a month.
References:
- Bartik, Timothy J. 2014. “How Effects of Local Labor Demand Shocks Vary with Local Labor Market Conditions.” Upjohn Institute Working Paper 14-202. Kalamazoo, MI: W.E. Upjohn Institute for Employment Research. https://doi.org/10.17848/wp14-202
- Autor, David, Frank Levy, and Richard J. Murnane. 2002. “Upstairs Downstairs: Computers and Skills on Two Floors of a Large Bank.” Industrial and Labor Relations Review, 55(3), April, 432–447.
- Elvery, Joel A. 2019. “Changes in the Occupational Structure of the United States: 1860 to 2015.” Federal Reserve Bank of Cleveland, Economic Commentary 2019-09. https://doi.org/10.26509/frbc-ec-201909
Credit & Debt
22-34% in debt collections
of households in the 3-county area were in debt collections in 2017.
Strong credit and low debt in collections help people prepare for the future and recover from economic shocks. Houstonians’ subprime credit rates and rate of residents with debt in collections are both high but show promising signs of improvement.
In this page we talk about the following:
Access to Credit and Household Debt
Good financial health is essential to economic security and upward mobility
Houston-area residents are more likely to be banked, have better credit access and quality, and be current on debt obligations than in the past. However, despite this improvement, the Houston region continues to lag behind the nation in key indicators of financial health, placing our most economically vulnerable residents at risk of financial exploitation.
Why debt and credit matter to Houston
Access to credit is vital for an individual’s and family’s economic stability and opportunity. The quality of our credit affects our ability to secure an apartment, get a job, obtain quality insurance, and acquire a loan for a home, business, vehicle, or education. For those facing financial constraints, the lack of credit (or the lack of good credit) can hinder opportunities for upward mobility, making it challenging to invest in one’s future, which perpetuates a cycle of economic insecurity. Conversely, for those with greater financial resources, accessing credit is a tool for leveraging opportunities and accumulating wealth through home or business loans.
People who lack a formal bank account, the unbanked, face greater challenges in accessing credit. Because they have been denied access to the traditional/official credit economy, unbanked individuals often resort to high-cost alternative financial services like payday lending, check cashing, etc. Individuals who use these services are more likely to face predatory lending in the form of high interest rates and struggle with repayments, which leads to excessive debt and traps the borrower in this cycle. This intensifies financial stress and limits the ability to save and plan for the future.
By ensuring credit access and promoting responsible lending practices, we foster economic empowerment, reduce financial vulnerability, and pave the way for long-term financial well-being for all Houston-area residents.
The data
Unbanked households in Houston are rising after years of decline
Accessing credit through the “official” credit economy (e.g., banks or credit unions), is optimal over utilizing non-traditional sources (e.g., check-cashing services, pawn shop loans, auto title loans, and paycheck advances/ payday loans), because it allows the credit holder expanded choices with greater flexibility, provides more favorable rates and fee levels, and can offer future rewards and benefits. However, people generally pursue these non-traditional routes because they have been denied access to traditional banking services.
Unbanked residents are those who rely on non-bank financial services such as check-cashing services, money orders, pawn shop loans, auto title loans, paycheck advances or payday loans to manage their finances. The unbanked are more likely to be younger, have lower incomes, less education, a disability, and identify as a person of color.1 Being unbanked also poses financial disadvantages. For example, you cannot access any systems that require a bank account to activate, such as direct deposit from an employer.
Underbanked households have a checking or savings account with a bank or credit union but also use alternative financial services (e.g., check-cashing services, money orders, international remittances, pawn shop loans, auto title loans, paycheck advances or payday loans) to manage their finances.
Households in the nine-county Houston Metropolitan Statistical Area (MSA) are more likely to be unbanked than the overall rate in Texas and the U.S. About 1 out of 11 Houston-area households are unbanked compared to 1 out of 15 in Texas and 1 out of 25 nationally. An additional 17% in the Houston Metro Area are underbanked, meaning one out of four households in the region uses non-traditional financial services, putting them at risk of exploitation and predatory financing. About three-quarters of Houston-area households are fully banked.
Between 2017 and 2021, the percentage of unbanked households declined across the nation, state, and Houston metro. However, as of 2023, this rate has increased in Houston and across Texas. The Houston metro area’s share of unbanked households is more than twice that of the nation and slightly above Texas.
There are significant racial/ethnic differences among the fully banked. Black and Latino households are much less likely to be fully banked and more likely to use non-traditional/alternative financial services than their white counterparts for three significant reasons: discrimination, income disparities, and access levels.
Black and Latino families have experienced explicit exclusionary practices within the financial system, such as redlining, and continue to experience more implicit forms today. Consequently, these discriminatory and harmful practices have contributed to a legacy of mistrust in the mainstream financial system among many people from historically marginalized communities. Many traditional banks typically require account holders to maintain a minimum balance, but if that threshold is not met, they generally charge additional fees and penalties, and, ultimately, may close or deny future accounts altogether. Black and Latino families have lower access to traditional banks and more access to alternative financial institutions. Not only are there fewer bank branches in predominantly Black and Latino neighborhoods, but also there is a saturation of payday loan stores and check cashing outlets.3
About 16% of Hispanic households in the Houston metro area are unbanked, compared to about 4% of white households. As with unbanked households, there are significant differences in underbanked households by the race and ethnicity of the household. For example, about 1 in 5 Hispanic households in the Houston metro area are underbanked, compared to about 1 in 10 white households that are underbanked.
Availability of credit in the Houston region improves, surpassing the state and nearing the national average.
Consumer spending patterns are closely linked to consumer confidence and overall economic health. Because credit drives and enables spending, access to credit tells us a lot about the overall economic well-being of our region and can be measured by the percentage of the population 15 years and older who utilize mainstream credit.
Mainstream credit refers to the full range of credit products that are typically reported to the nationwide credit reporting agencies that form the basis of your credit history and influence your credit score. A credit score is a numerical representation of an individual’s creditworthiness, which is used by lenders, creditors, and other financial institutions to evaluate the risk associated with extending credit or lending money. Credit scores are primarily based on an individual’s credit history, which includes factors such as payment history, amounts owed, length of credit history, types of credit, and recent credit inquiries.
In 2023, about 82% of adults in the Houston Metro Area used mainstream credit in the past 12 months performing about on par with the state of Texas for this indicator and slightly below the national average.
Having a credit file and credit score does not ensure timely access to credit. Revolving credit provides immediate credit at the credit-holder’s discretion. These lines of credit are called revolving credit because once made available, the credit is used, then paid for, and finally made available once again in a revolving cycle.4 Most people who participate in the credit economy have revolving credit in the form of a credit card or a home equity line of credit.
The percentage of adults who used revolving credit — in the form of a credit card — has increased by 10 percentage points in Texas and across the country since 2015. The Houston Metro Area saw this rate increase 17 points, and as of 2023 outperforms the state and is nearly on par with the nation overall. As of 2023, about three quarters of Houston metro residents have access to revolving credit in the form of a credit card.
Despite improvement, about a quarter of residents have a low credit score
Accessing credit through the “official” credit economy (traditional pathways such as banks or credit unions), is optimal over utilizing non-traditional sources (e.g., check-cashing services, pawn shop loans, auto title loans, and paycheck advances/ payday loans), because it allows the credit holder expanded choices with greater flexibility, provides more favorable rates and fee levels, and can offer future rewards and benefits.
However, people generally pursue these non-traditional routes because they have been denied access to the traditional/official credit economy, meaning these individuals are denied loans from traditional banks, are not issued credit cards, or don’t have valuable collateral to exchange. This leaves about 25% of our region with limited options while in a desperate situation. Not surprisingly, their vulnerability places them at greater risk of exploitation in the form of sky-high interest rates, exorbitant fees, and makes them more likely to need these services again.
Strong credit quality helps a family’s financial standing and positively impacts access to future credit that can allow a family to invest in wealth-building assets such as buying a home or building a business. Credit quality is determined by credit history and is measured by the percentage of individuals in the credit economy who have reliable payment history — meaning, they are consistently current on all financial obligations.
Falling behind on bill payments is a potential indicator of creditworthiness, providing insights into a household’s ability to satisfy its financial obligations and access different forms of credit. Across the Houston Metro Area, residents are about as likely to be current on all financial obligations as the average American with 87% of residents not falling behind on bill payments. Conversely, 13% of Houston area residents did fall behind on bill payments in 2023.
When debts are not paid on time, the credit holder’s credit score is lowered, which results in a reduction in access to future credit. Credit scores are used to evaluate the risk associated with extending credit or lending money, and they are based on an individual’s credit history, which includes factors such as payment history, amounts owed, length of credit history, types of credit, and recent credit inquiries.
Credit scores range from 300 to 850, with higher scores indicating “better creditworthiness.” A good credit score can help individuals secure better interest rates on loans, credit cards, and mortgages, as well as make it easier to rent an apartment or obtain certain types of employment.
Conversely, a low credit score can make it more difficult to obtain credit or result in higher interest rates, making borrowing more expensive. Individuals with a credit score below 660 are considered to have subprime credit. People who have subprime credit scores have limited options to access credit. The type of credit available to them is often high-risk because it comes with higher interest rates and exploitive repayment plans that can often trap individuals in a cycle of debt. Measuring the percentage of people with subprime credit has been used as an indicator of the health of Houston-area residents’ ability to access credit.
In 2023, Harris County had a higher rate of residents with a subprime credit score (i.e., below 660), with nearly 1 in 3, compared to Fort Bend and Montgomery counties where 1 in 4 residents had subprime credit scores. Fortunately, across all three counties the rate of residents with a subprime credit score has decreased by 5-6 percentage points since 2015 but have stagnated since 2021.
Medical debt in collections falls while student debt in default rises
Once we gain access to credit, we then hold a debt for that amount plus interest and any fees. Having debt is not necessarily a bad thing. Incurring debt can allow us to invest in something that has the potential to pay off later, build a positive credit history, give tax benefits, and more. Being in debt to buy a home, start a business, and pay for high-quality education or in-demand skills training have been identified as good investments that can increase one’s economic security and opportunity, including accumulating wealth.
However, unproductive debt is debt incurred to pay for basic needs and living expenses. We are more likely to accumulate unproductive debt during an unforeseen job loss or medical crisis, or because our current resources do not cover our expenses. Because it does not have the same long-term benefits, unproductive debt is riskier for the debt holder and society at large.5
An overreliance and dependence on credit can lead to the accumulation of unhealthy debt levels, which reduces the ability to make on-time full payments. When residents can’t meet payment obligations, they face additional fees and penalties, higher interest rates, lower credit scores, the potential loss of property such as vehicles and homes, and/or debt can go into collections. Debt goes into collections when the original creditor cannot collect payment on the debt, so they either sell or transfer the debt to a collections agency that tries to recover the money. Consequently, it becomes harder and more expensive to access credit.
Total Debt
The percentage of individuals in the credit economy with debt in collections has consistently been much higher at the state (Texas) level, since 2017, compared to the national level. About 32% of Texans have debt in collections compared to 22% among all Americans. Texas — along with Louisiana, South Carolina, and Georgia — has the highest percentage of people with debt in collections in the nation. This finding is even more striking since Texas is the second-most populous state.
In Harris County, 34% of residents have debt in collections, the highest level in Houston’s three-county region. About 22% of people in Fort Bend County and 25% in Montgomery County also have debt in collections, which is closer to the national level.
The percentage of individuals in the credit economy with debt in collections has declined nationally and in Texas since 2017. Between 2017 and 2023, the percentage of debt in collections fell seven percentage points in Fort Bend, nine points in Montgomery County, and ten percentage points in Harris County.
This decrease may be due to a combination of (1) the National Consumer Assistance Plan (NCAP) that was fully implemented in 2018 which changed reporting requirements and resulted in 8 million people having collections accounts removed from their credit report6; and (2) federal government action like mortgage and student loan forbearance implemented to mitigate the effects of the pandemic.7 In Texas specifically, the winter storm of 2021 also resulted in a large increase in mortgage forbearance in the state.8
Medical Debt
Medical debt refers to the share of people with a credit bureau record who have medical debt in collections. Texas has more people with medical debt in collections (9%) than the national rate (5%). Harris Montgomery counties have the highest share of debt holders with outstanding medical debt in the region (6%).
Texas saw a 17-percentage-point decrease in medical debt in collections between 2017 (26%) and 2023 (9%) but still remains slightly higher than the national average of 5%. Harris and Montgomery counties both saw a decrease of 12 and 13 percentage points, respectively, and both counties remain in line with the national percentage (5%).
The national decline in medical debt in collections is partially due to reforms in credit reporting practices. In 2022, credit-reporting companies removed medical debts in collections (that were eventually paid) from credit reports and extended the grace period for reporting unpaid medical debts from six months to one year. In 2023, medical debts in collection under $500 were excluded from credit reports entirely. It is estimated that within one year of these changes, more than 15 million Americans had their medical debt in collections erased from their credit reports and, as a result, roughly 27 million adults were able to increase their credit score from subprime (below 660) to near prime (between 601 and 660).5
Student Loan Debt
Student loan debt refers to the share of people with any student loan debt who are in default/debt in collections. While total and medical debt in collections have shown a decline, the past year has seen an increase in the rate of residents who have student loan debt in collections. About 15% of people in Texas and the nation are in this position, which is on par with regional rates.
Between 2017 and 2022, the percentage of student loan borrowers in default declined with Fort Bend County experiencing the largest reduction at 10-percentage points. However, rates of student loan defaults have increased, reversing past progress. As of 2023, Fort Bend County had the highest student loan default in the region at 17%.
The general downward trend in student loan defaults is largely due to the student debt loan relief implemented during the pandemic and extended through mid-2023.10 On March 13, 2020, the federal government granted forbearance on student loan payments toward eligible loans. Forbearance allows borrowers to pause or reduce debt payments during periods of hardship, without showing the loan delinquent on the credit report.11
Debt in Collections by Race/Ethnicity
As described in the Unbanked/Underbanked section above, the ability to access credit has historically been more fraught for people from historically marginalized communities, particularly for Black and Latino households. Because finance policies disproportionately harmed some groups while simultaneously benefiting others, disaggregating this indicator by race and ethnicity is helpful. Additionally, debt can often burden family and community well-being and reinforce the wealth gap between white and non-white communities of color.6
In each geography, ZIP Codes where at least 50% of the population identifies as Black, Indigenous, Asian, Hispanic, or another non-white group are much more likely to have debt in collections than white communities (where at least 50% of residents are white).
Across the nation in 2023, 29% of communities of color had debt in collections, compared with 19% of white communities. More than a third of the people who live in communities of color within Texas, Harris County, and Montgomery County have debt in collections. In 2023, the percentage of debt in collections for communities of color compared to white communities was 19 percentage points higher in Harris County, 13 points higher in Montgomery County, 6 points higher in Fort Bend County, 12 points higher at the state level, and 10 points higher at the national level.
More Helpful Articles by Understanding Houston:
- COVID-19 Recovery and the Ongoing Challenges Facing Houston Entrepreneurs
- Houston is Entrepreneurial
- The Great She-cession: How COVID-19 is impacting women in the workforce
References:
- Board of Governors of the Federal Reserve System, Economic Well-Being of U.S. Households in 2023 (Washington: Board of Governors, 2024), https://doi.org/10.17016/8960.
- Small, M. L., Akhavan, A., Torres, M., & Wang, Q. (2021). Banks, alternative institutions and the spatial–temporal ecology of racial inequality in US cities. Nature Human Behaviour, 5(12), 1622-1628.
- Community Credit: A New Perspective on America’s Communities, Federal Reserve Bank of New York, February, 2022
- Ratcliffe, Caroline, Signe-Mary McKernan, Brett Theodos, Emma Kalish, John Chalekian, Peifang Guo, Christopher Trepel, An Opportunity and Ownership Brief. “Delinquent Debt in America.” Urban Institute Report, Washington, DC, Urban Institute (2014).
- Fredric Blavin, Breno Braga, Michael Karpman. Medical Debt Was Erased from Credit Records for Most Consumers, Potentially Improving Many Americans’ Lives. Urban Wire (2023).
- McKay, K. L., Smith-Ramani, J., & Hasan, T. (2022). Disparities in Debt: Why Debt is a Driver in the Racial Wealth Gap. Retrieved from https://www.aspeninstitute.org/publications/disparities-in-debt-why-debt-is-a-driver-in-the-racial-wealth-gap/
Small Business
7 point decrease
in the percentage of Houston-area small businesses owned by women between 2020 and 2021.
Small businesses provide wealth-building opportunities for and contribute to growth and vitality in local communities. Immigrants, people of color, and women sometimes start businesses as a necessity to overcome employment barriers, challenges in building personal wealth, and discrimination.
In this page we talk about the following:
Small Business in Houston
As significant contributors to our regional economy, small businesses provide income and wealth-generating opportunities for residents
Despite the pandemic’s immediate effect on the economy, small business growth in Houston’s three-county region remains strong. Yet, disparities persist for women and others who come from historically marginalized backgrounds.
Why small businesses matter to Houston
Small businesses, critical to economic and community development, are considered the lifeblood of our national, state and local economies. As major drivers of employment, small businesses and the entrepreneurs who run them are beneficial to our economy and stimulate growth by helping to lower poverty and reinvest in low-income areas.1 2 Small businesses also empower individuals and strengthen communities by employing and paying residents who spend their money in the community and increase the local tax base. Small businesses also provide income and wealth-building opportunities for people who may face larger employment barriers or discrimination, including immigrants, Black, Indigenous, and other people of color (BIPOC), and women.
However, barriers such as lack of credit access, social capital, and generational wealth have a disproportionate effect on aspiring female and BIPOC entrepreneurs, preventing their full contributions to the small business economy. The more we understand the systemic obstacles unique populations face in building small businesses, the more we can do to support their — and our region’s — collective success.
The data
Small business growth in Fort Bend and Montgomery counties outpaces Harris County
While the definition of small businesses can vary depending on industry, employee count, level of revenue, the U.S. Small Business Administration (SBA), defines a small business as one that is independently owned and operated, exerts little influence in its industry, and (with some exceptions) has fewer than 500 employees. According to the SBA, small businesses of 500 employees or fewer make up 99.9% of all U.S. businesses and created 17.3 million net new jobs between 1995 and 2021, accounting for nearly two-thirds of new net jobs created. A 2019 SBA report found that small businesses accounted for 44% of U.S. GDP.
Because nearly all businesses employ fewer than 500 people, and our geographic scope is regional, Understanding Houston focuses its analysis on businesses that employ between 1 and 9 people, inclusive. In 2022, there were nearly 14,000 small businesses (with fewer than 10 paid employees) in Fort Bend, 77,900 in Harris, and 10,700 in Montgomery counties. Between 2010 and 2022, the number of small businesses grew 101% in Fort Bend County, 22% in Harris County, 62% in Montgomery County, 27% in Texas overall, and 12% nationally.
At 78.9%, Fort Bend County had the highest percentage of businesses with fewer than 10 employees in Houston’s three-county region in 2022 — nearly four percentage points higher than in 2010. In Montgomery County, 73.4% of businesses employed fewer than 10 people. In comparison, Harris County (70.9%) had the lowest proportion of businesses with fewer than 10 employees in the area, which is slightly lower than the state and U.S. level.
Women-owned businesses in Houston decreased
Not only do small businesses create jobs and add to the economy, they provide wealth-building opportunities for and contribute to growth and vitality in local communities. In particular, creation of small businesses by immigrants, people of color, and women — sometimes a necessity to overcome employment barriers, challenges in building personal wealth, and discrimination — can help increase economic opportunity — a cornerstone of the American Dream. A 2022 study found that immigrants are about 80 percent more likely to found a business, compared to native-born citizens. Immigrant-owned firms also have about 1 percent more employees than those founded by U.S. natives, on average.3
Overall, the percentage of businesses with fewer than 10 paid employees are more likely to be owned by people of color (defined as anyone who does not identify as non-Hispanic white) in the nine-county Houston-The Woodlands-Sugar Land Metropolitan Statistical Area (Houston MSA) than in Texas and the U.S. overall.
In the Houston MSA, 38.5% of small businesses are owned solely by people of color, compared to 32.4% in Texas and 21.0% across the nation. In particular, Asian Americans are overrepresented among business owners — they own 22.2% of small businesses in the region, but comprise 8% of the MSA’s population. Additionally, the Houston MSA has a higher rate of Asian-American-owned small businesses than Texas (14.5%) and the U.S. (11.6%). The percentage of Hispanic-owned businesses was also much higher in the Houston MSA (11.2%) than the U.S. (7.3%), but slightly lower than in Texas (14.5%). More small businesses in Houston are also Black owned at 4.7% compared to Texas (3.0%) and the U.S. (2.8%).
In 2020, small businesses in the Houston MSA were slightly more likely to be owned by women compared to the state and the nation. In the Houston MSA in 2020, 24.6% of small businesses were owned solely by women compared to about 22% in Texas and the U.S. However, between 2020 and 2021, the percentage of women-owned small businesses in Houston decreased 8 percentage points from 25% in 2020 to 17% in 2021.
More Houstonians work for themselves
Nonemployer businesses have no paid employees, annual business receipts of $1,000 or more, and are subject to federal income taxes. Most nonemployers are self-employed individuals (e.g., real estate agents, independent contractors) operating unincorporated businesses (known as sole proprietorships), which may or may not be the owner’s principal source of income. According to the Census Bureau, the majority of all business establishments in the United States are nonemployers, yet these firms average less than 4 percent of all sales and receipts nationally.
The number of nonemployer businesses in Fort Bend County increased 96% to 101,570 in 2021 from 2010 — the most rapid growth rate in Houston’s three-county region. In Montgomery County, nonemployer businesses grew 78% to 67,438in 2021 from 2010. Growth in Harris County (49%) was similar to Texas (48%); and the state and region outpaced the national growth rate (29%).
The over 680,000 nonemployer businesses in Houston’s three-county region generated nearly $36 billion dollars in revenue in 2021 — this is a 75% increase from 2010 — with the greatest growth in Fort Bend and Montgomery counties.
Helpful Articles by Understanding Houston:
- Houston is Entrepreneurial
- The Great She-cession: How COVID-19 is impacting women in the workforce
- COVID-19 Recovery and the Ongoing Challenges Facing Houston Entrepreneurs
References:
- Rupasingha, Anil.” Locally owned: Do local business ownership and size matter for local economic well-being?” Federal Reserve Bank of Atlanta No. 2013-01 (2013).
- Kugler, Maurice, Marios Michaelides, Neha Nanda, and Cassandra Agbayani. “Entrepreneurship in Low-Income Areas.” US Small Business Administration Office of Advocacy, 2018.
- Azoulay, Pierre, Benjamin F. Jones, J. Daniel Kim, and Javier Miranda. 2022. “Immigration and Entrepreneurship in the United States.” American Economic Review: Insights, 4 (1): 71-88.